Fig. 1.
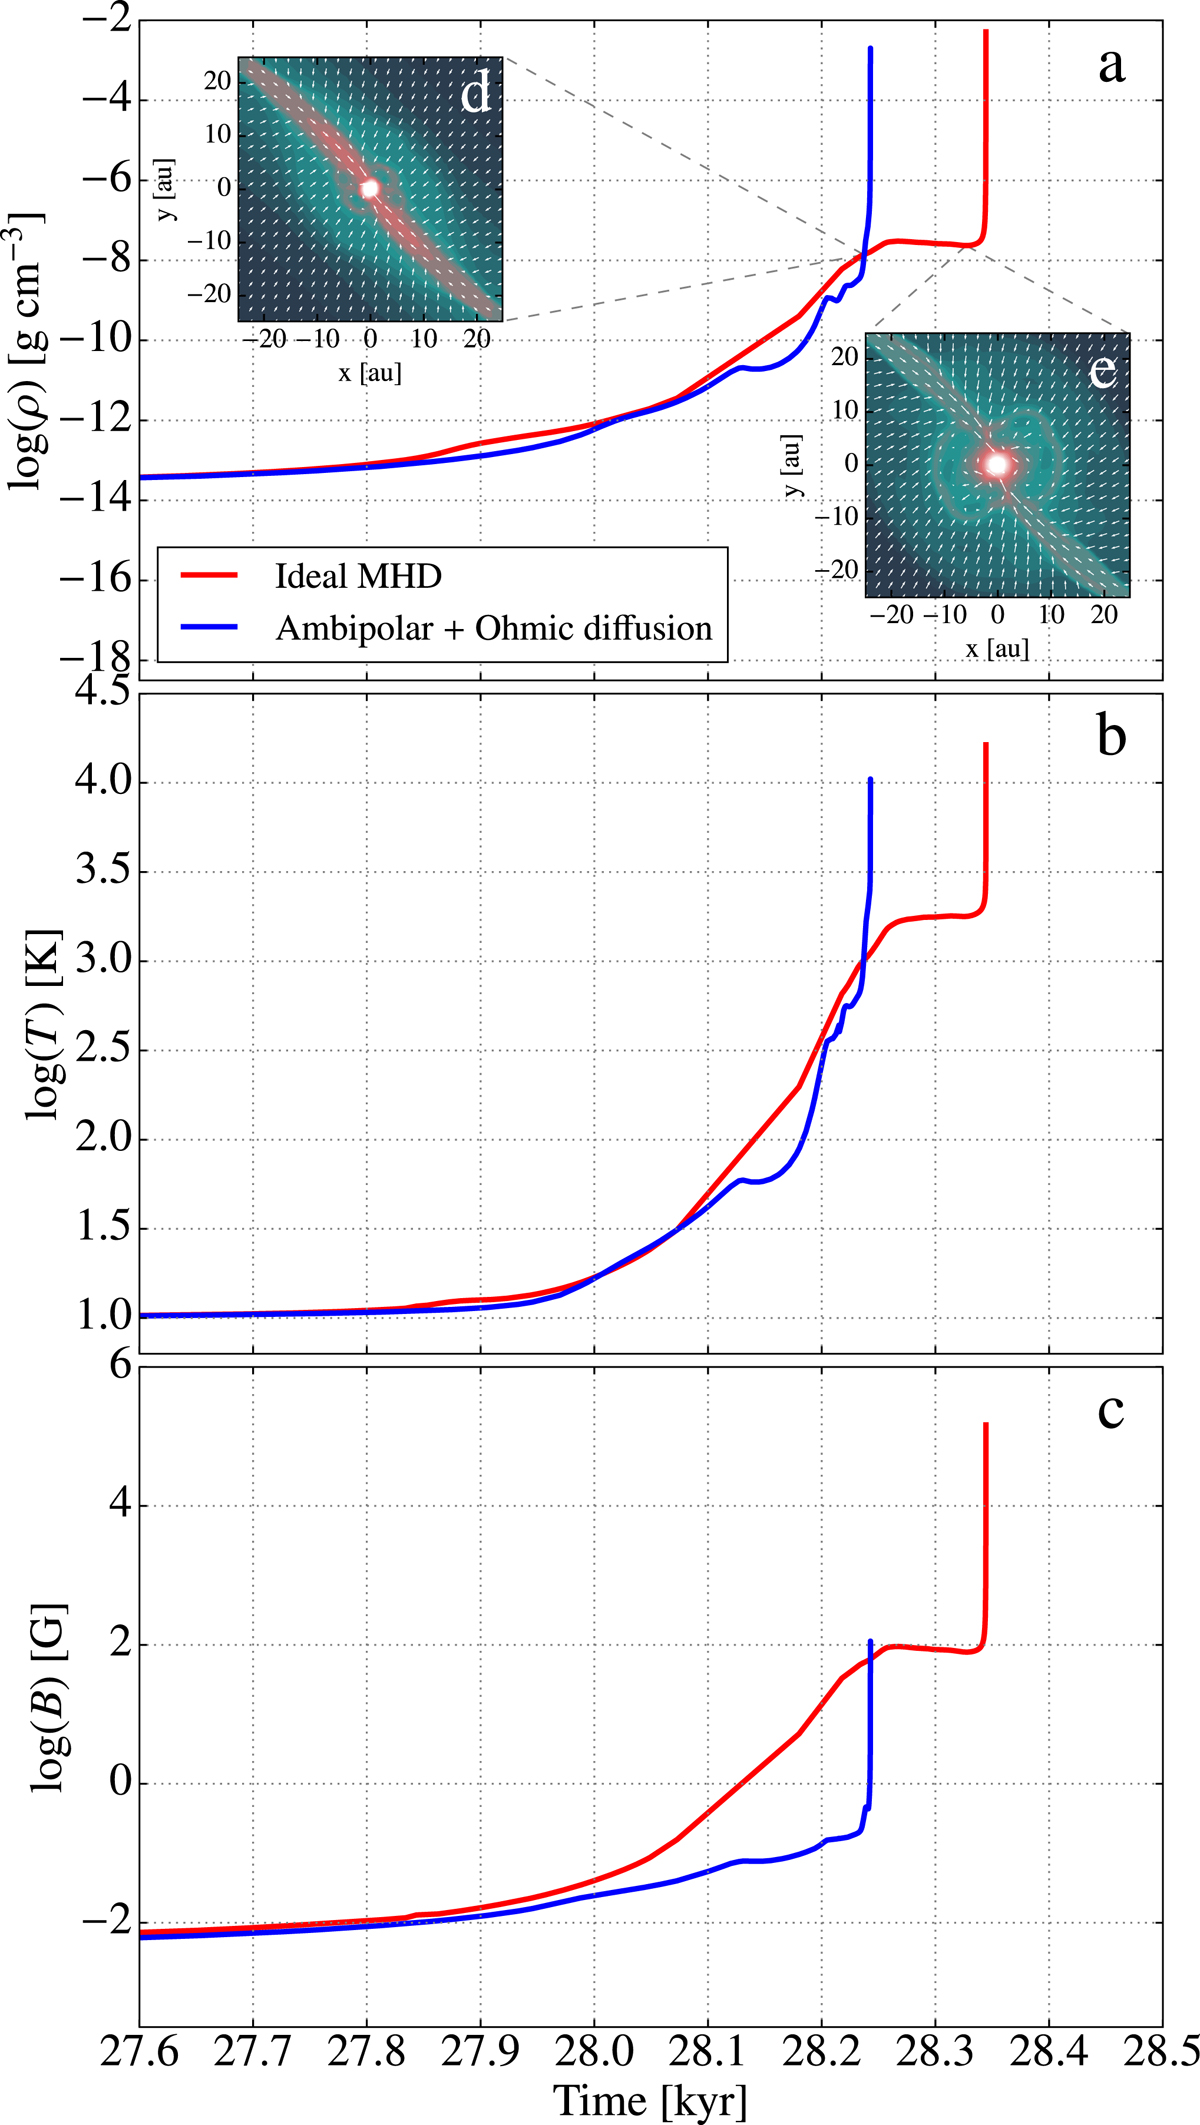
Density (panel a), temperature (panel b) and magnetic field strength (panel c) as a function of time, for the densest cell in the system. The red lines represent runID, while the blue lines are for runAO. In the top panel, the two insets show maps of the logarithm of density in runID just before (panel d) and after (panel e) the development of the interchange instability (see text).
Current usage metrics show cumulative count of Article Views (full-text article views including HTML views, PDF and ePub downloads, according to the available data) and Abstracts Views on Vision4Press platform.
Data correspond to usage on the plateform after 2015. The current usage metrics is available 48-96 hours after online publication and is updated daily on week days.
Initial download of the metrics may take a while.