Fig. 4.
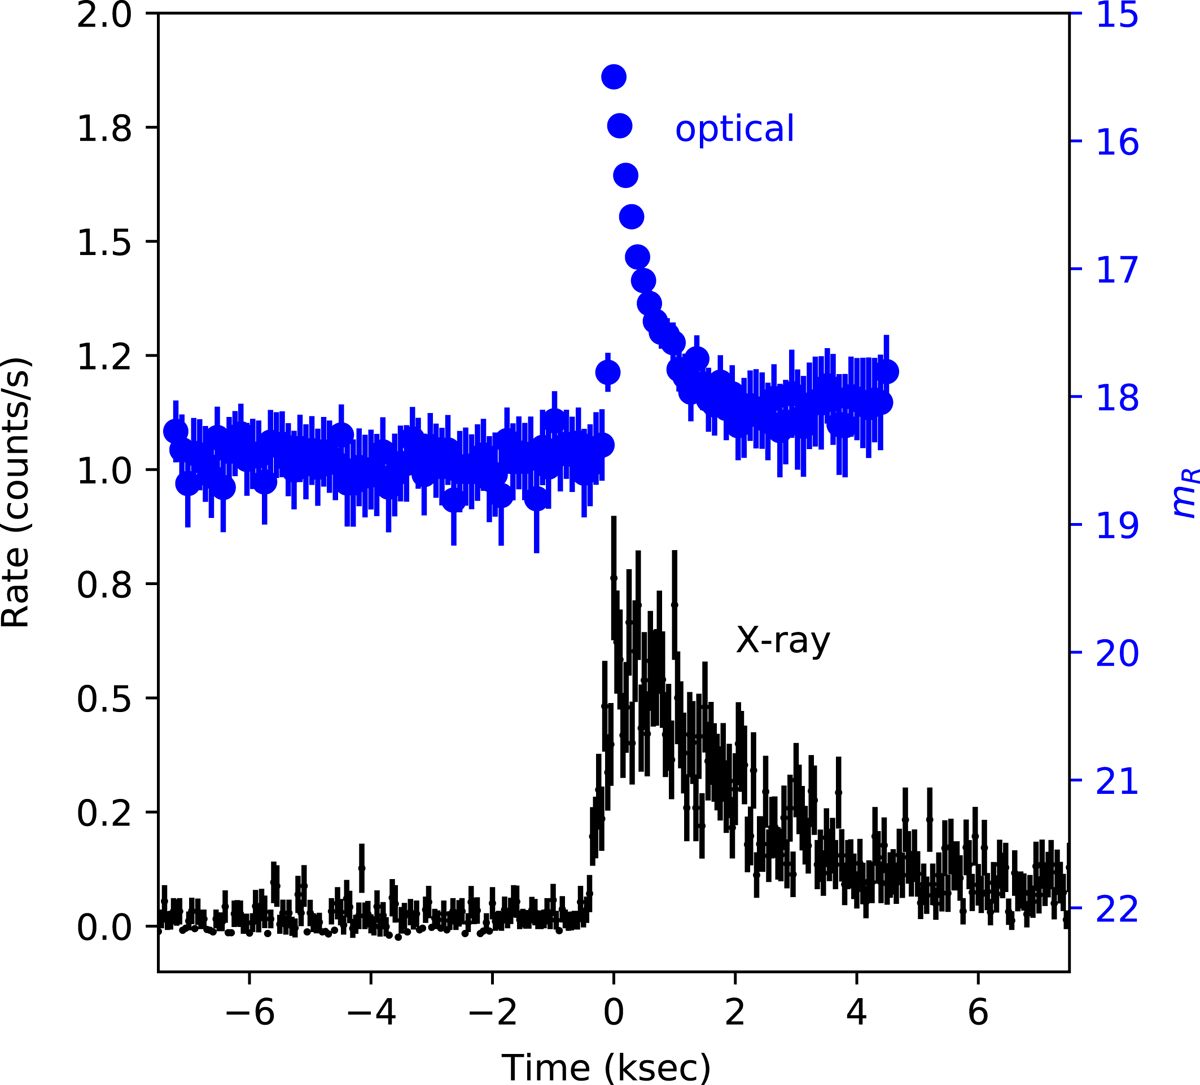
Top, blue: optical iPTF light curve of V07979 from 31 January 2013 (Fig. 1 left panel), and bottom, black: X-ray flare at the position of V07979 from an XMM-Newton observation of the central part of M 31 on 28 January 2008 produced by the PPS of XMM-Newton SSC. The horizontal axis shows time with respect to the corresponding peak time for both light curves.
Current usage metrics show cumulative count of Article Views (full-text article views including HTML views, PDF and ePub downloads, according to the available data) and Abstracts Views on Vision4Press platform.
Data correspond to usage on the plateform after 2015. The current usage metrics is available 48-96 hours after online publication and is updated daily on week days.
Initial download of the metrics may take a while.