Fig. 3.
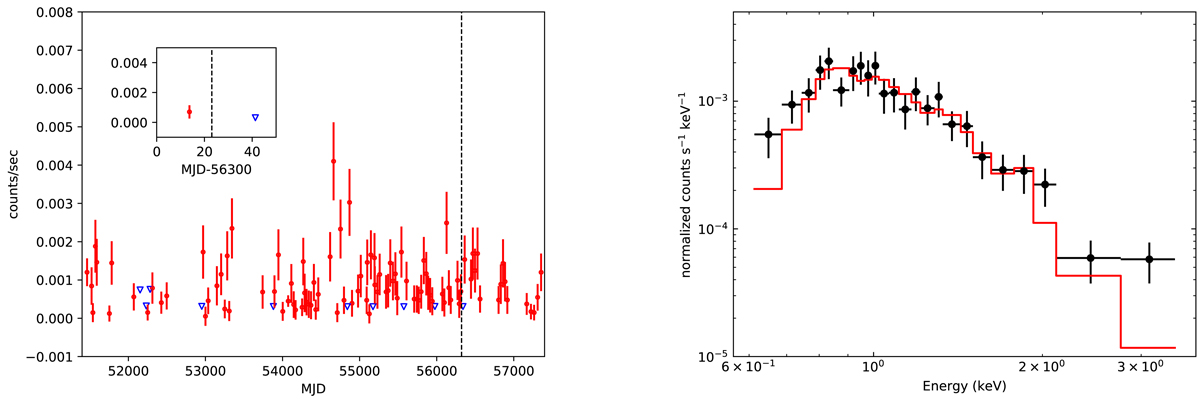
Left panel: X-ray light curve of V07979 based on the observations from Chandra. For those observations for which the count rate is zero, upper limits are given and are indicated by the blue triangles. Unfortunately, there is no X-ray observation on 31 January 2013, which is indicated by the dashed black line, and shown zoomed in in the inset. Right panel: observed spectrum of V07979 extracted from the Chandra observations in the left panel, where S/N > 1.5 (black points). The red curve is the fitted model (an absorbed thermal plasma model) using XSPEC (see text for details).
Current usage metrics show cumulative count of Article Views (full-text article views including HTML views, PDF and ePub downloads, according to the available data) and Abstracts Views on Vision4Press platform.
Data correspond to usage on the plateform after 2015. The current usage metrics is available 48-96 hours after online publication and is updated daily on week days.
Initial download of the metrics may take a while.