Fig. 10
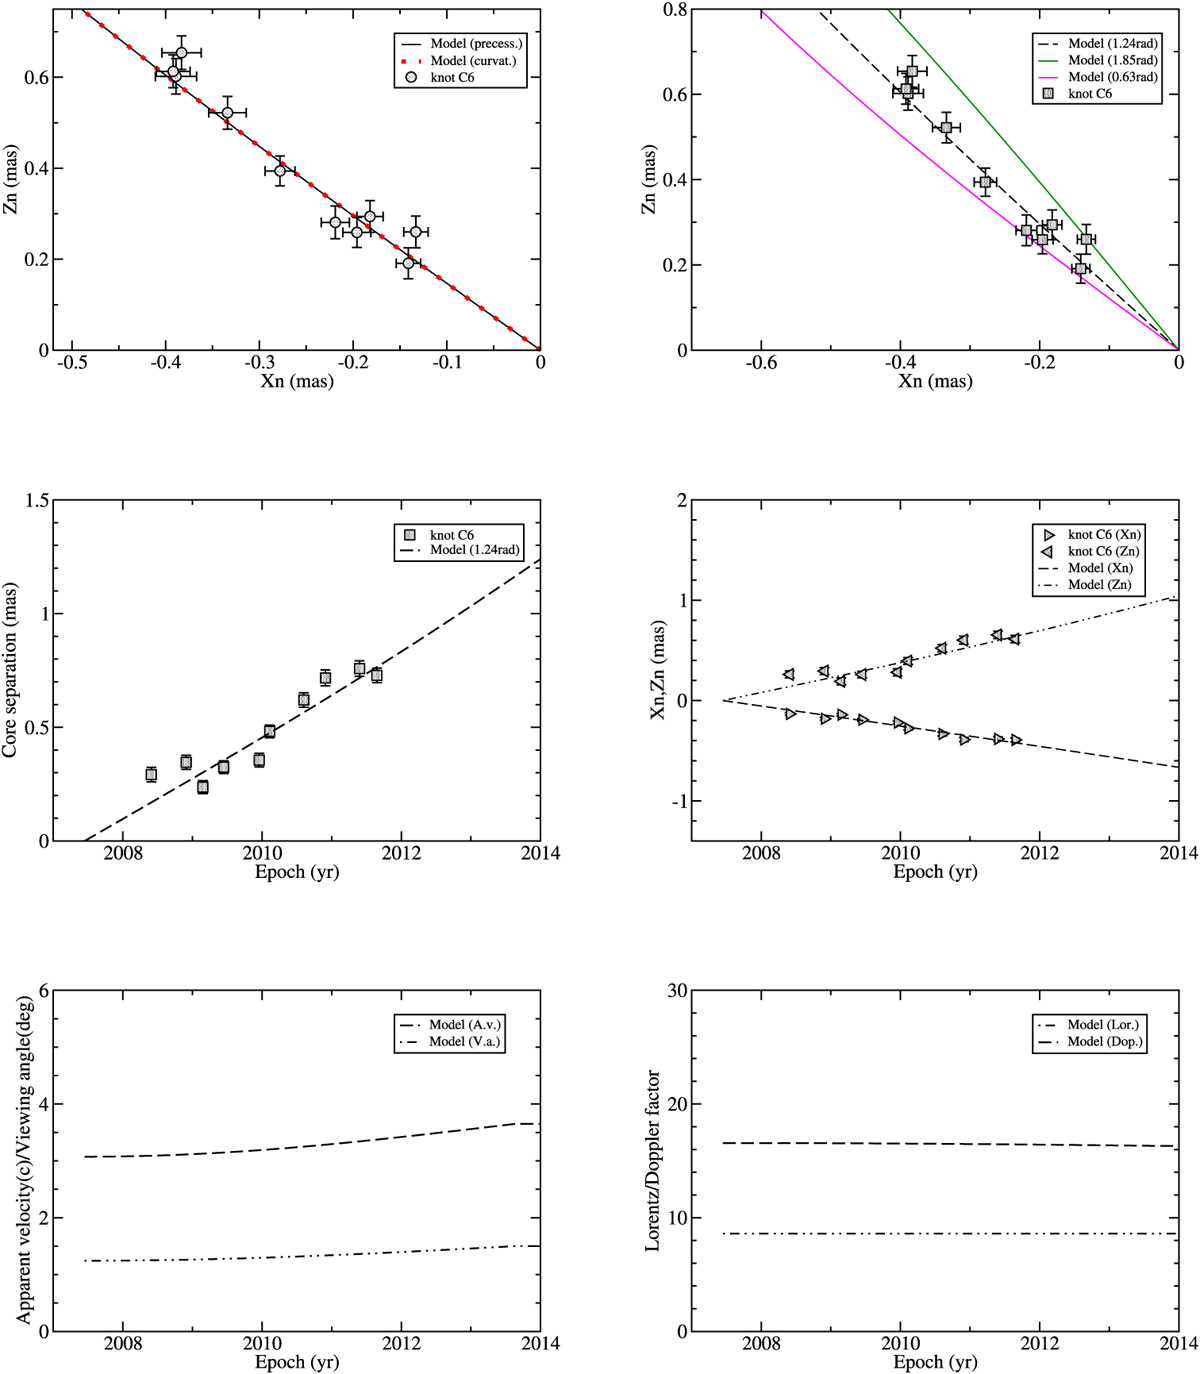
Model fitting results for knot C6. Knot C6 moves along the precessing common trajectory during the whole observation period. In the upper left panel the solid black line (modeling the inner trajectory) and the dashed red line (modeling the entire trajectory) coincide. In the upper right panel three modeled trajectoryies are shown for t0 (black dashed line) and t0 ± 0.5 yr (or ϕ ± 0.61 rad; green and magneta lines), demonstrating that most of the observation data points are within the position angle range defined by the two additional modeled trajectories and the precession period is determined within an uncertainty of ~ ± 0.5 yr.
Current usage metrics show cumulative count of Article Views (full-text article views including HTML views, PDF and ePub downloads, according to the available data) and Abstracts Views on Vision4Press platform.
Data correspond to usage on the plateform after 2015. The current usage metrics is available 48-96 hours after online publication and is updated daily on week days.
Initial download of the metrics may take a while.