Fig. 5
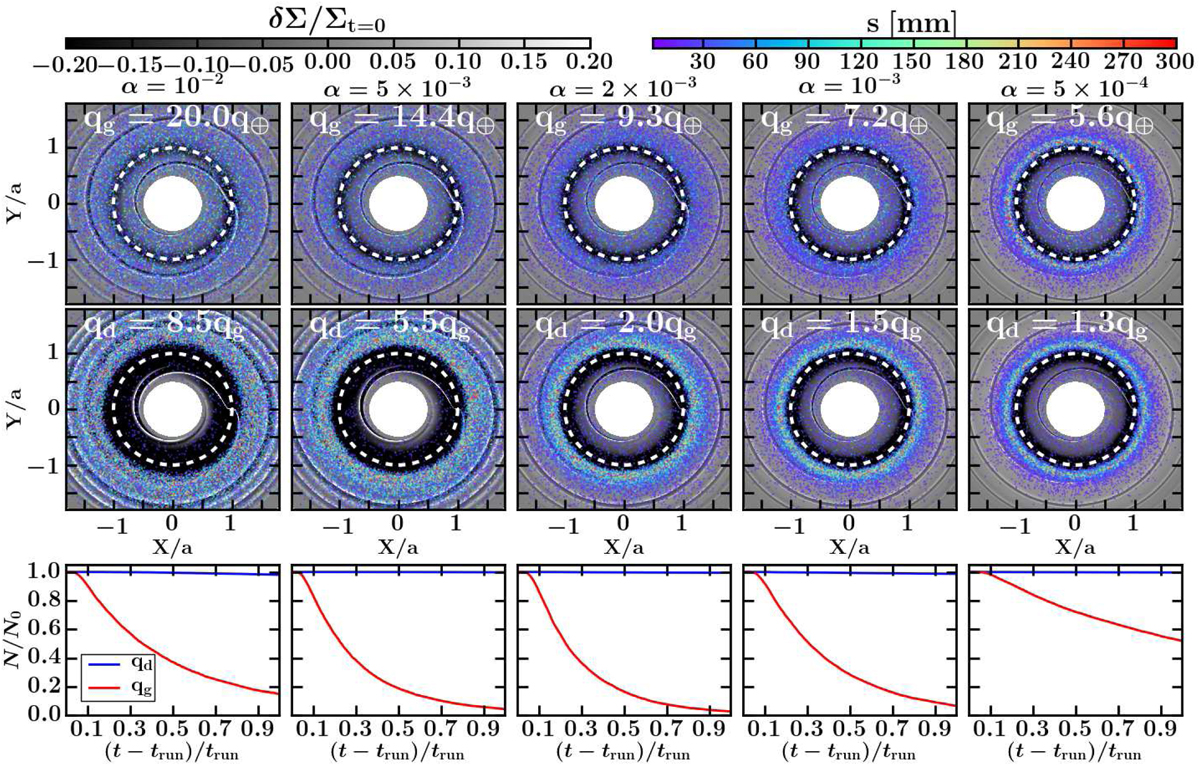
Results of the gas plus dust hydrodynamical simulations with dust turbulent diffusion for h = 0.04. The alpha turbulent viscosity decreases from left to right. First and second rows show the relative perturbation of the gas surface density (in black and white) with dots showing the location of dust particles (the colour of the dots indicates particles size). The first row shows results for q = qg, that is when the mass of the planet equals the PIM inferred from the gas-only simulations (q⊕ is the Earth to Sun mass ratio). The second row represents q = qd, that is when the mass of the planet equals the PIM obtained from the gas plus dust simulations. In each panel the white dashed circle indicates the orbital radius of the planet. The third row of panels represent the time evolution of N∕N0, which is the ratio of particles number with size >10 mm that remain outside of the orbital radius of the planet.
Current usage metrics show cumulative count of Article Views (full-text article views including HTML views, PDF and ePub downloads, according to the available data) and Abstracts Views on Vision4Press platform.
Data correspond to usage on the plateform after 2015. The current usage metrics is available 48-96 hours after online publication and is updated daily on week days.
Initial download of the metrics may take a while.