Fig. A.2
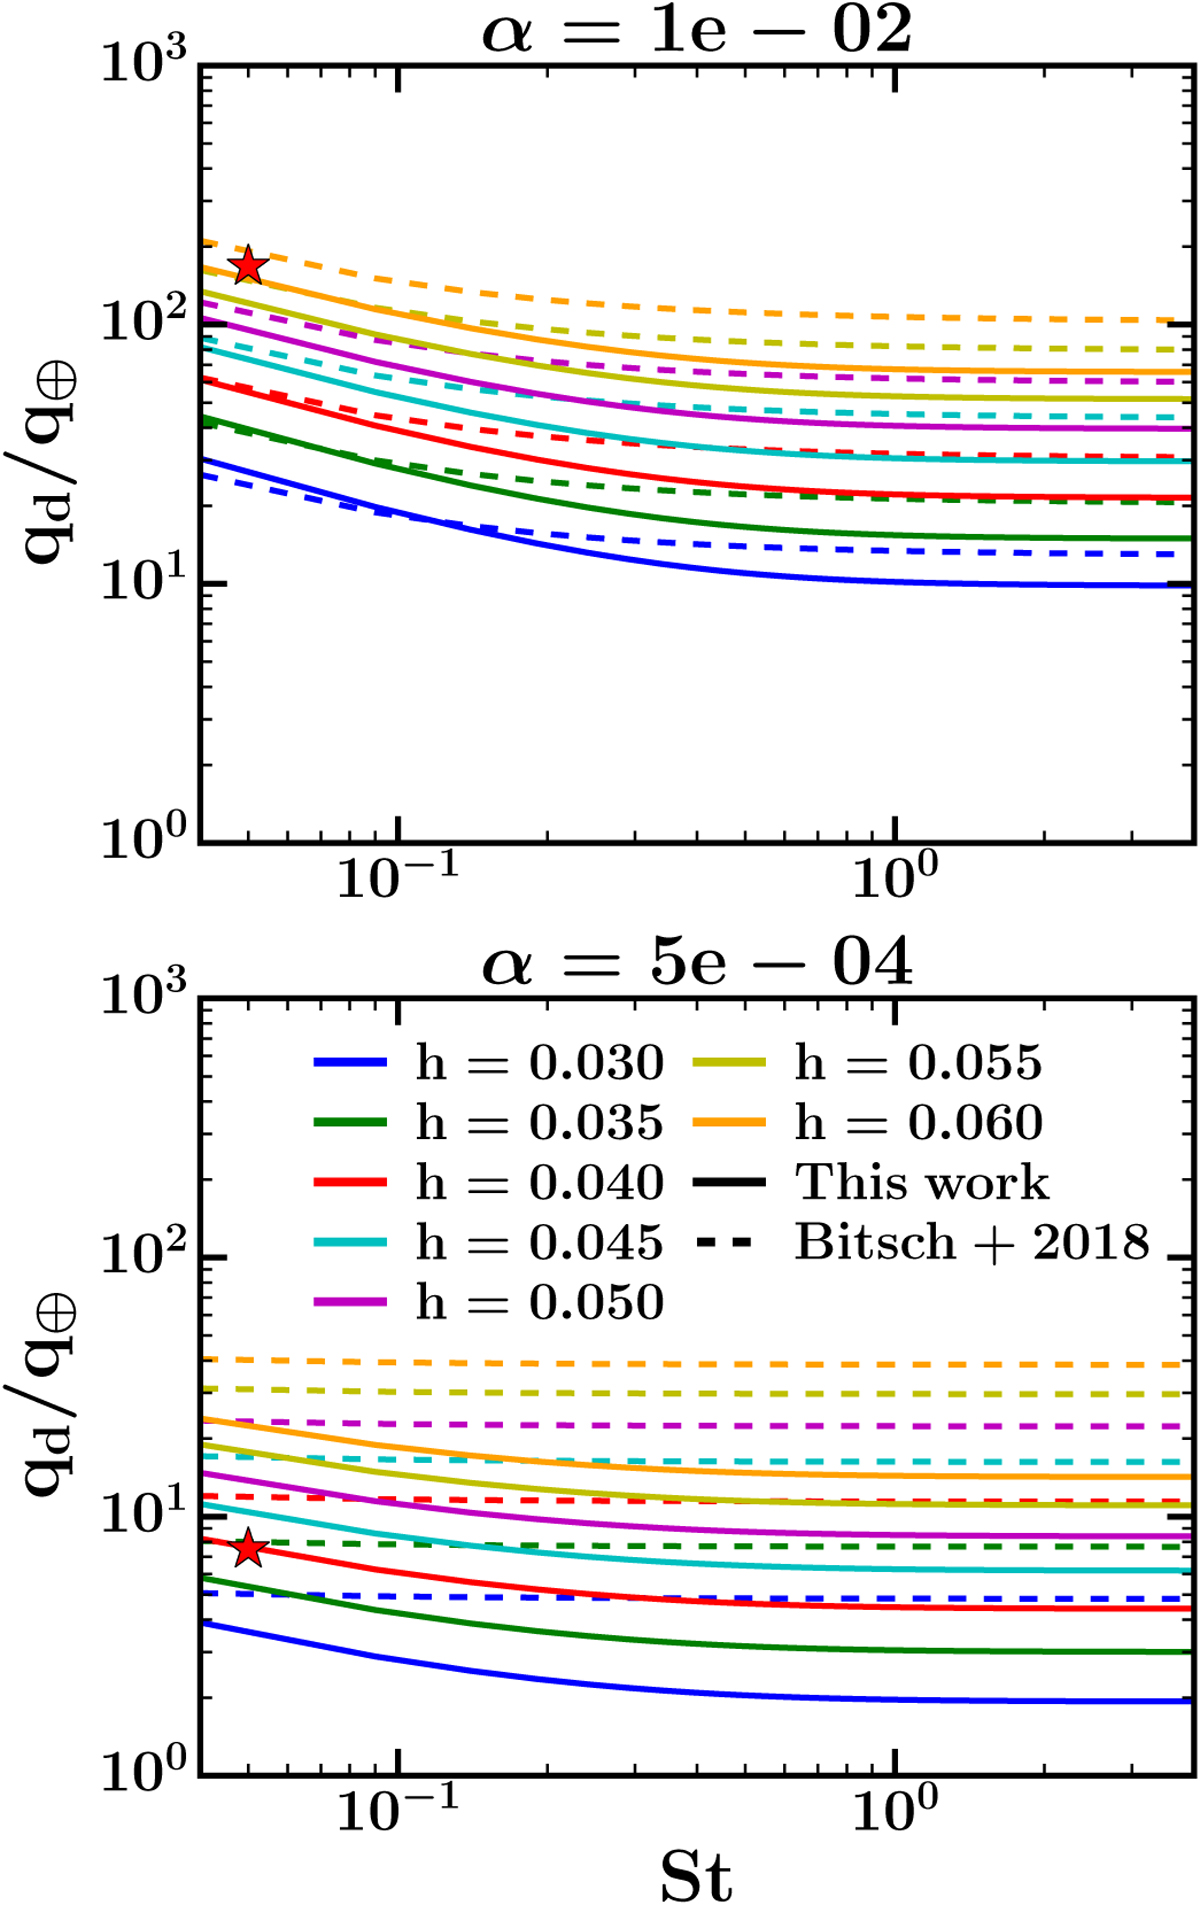
PIM (in Earth masses) with effects of dust turbulent diffusion. A comparison between the results of our semi-analytical calculation (solid curves) and those of (Bitsch et al. 2018; dashed curves) for Σ ∝ r−0.5, uniform aspect ratios and two values of the turbulent viscosity of the disk: α = 10−2 (upper panel) and α = 5 × 10⁻⁴ (lower panel). The red stars indicate the PIM obtained from our 2D gas plus dust simulations (for h = 0.04).
Current usage metrics show cumulative count of Article Views (full-text article views including HTML views, PDF and ePub downloads, according to the available data) and Abstracts Views on Vision4Press platform.
Data correspond to usage on the plateform after 2015. The current usage metrics is available 48-96 hours after online publication and is updated daily on week days.
Initial download of the metrics may take a while.