Fig. 2
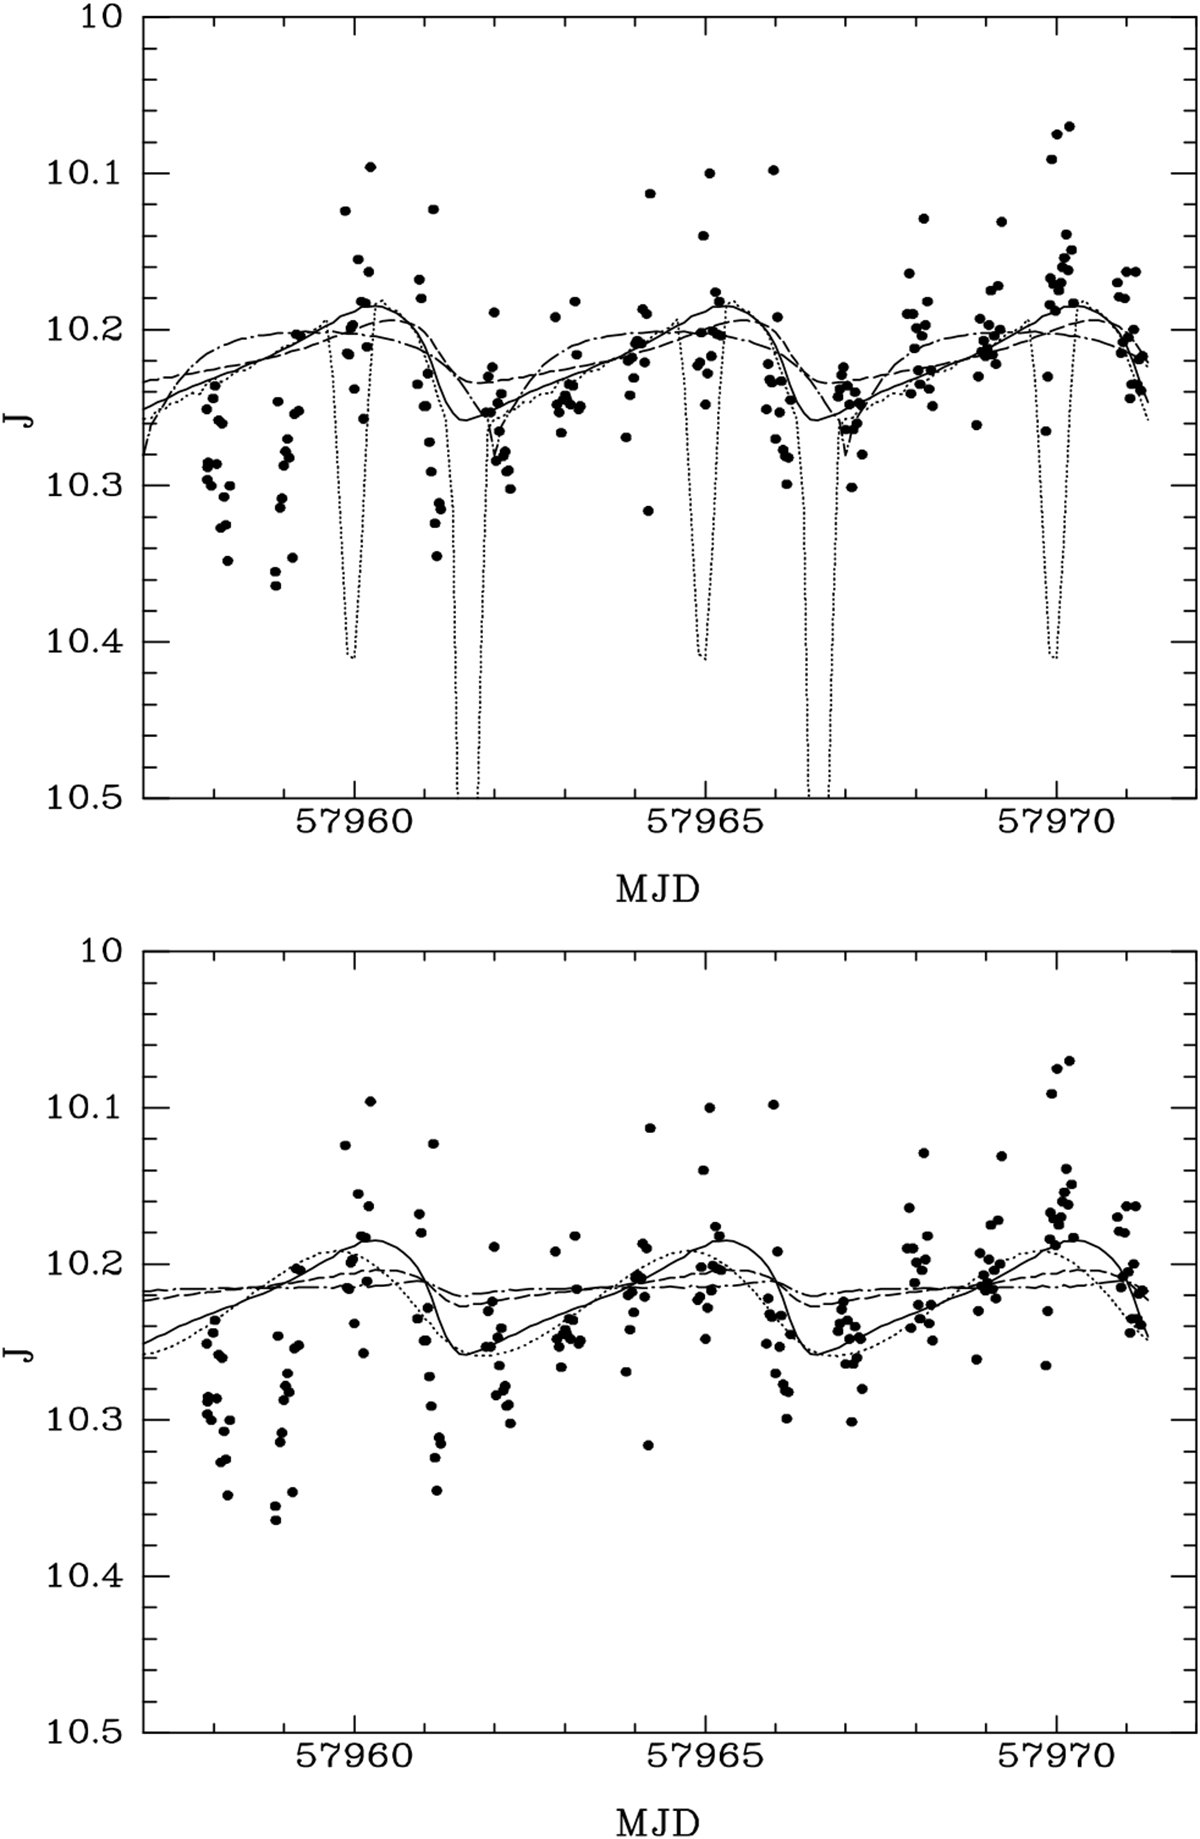
Various Wilson–Devinney fits to the J-band light curveof S106IR. Top panel: the solid line indicates the best fit model with the parameters given in Table 1. The dashed line indicates the same as the best-fit model but with an inclination i = 30°, closer to a pole-on view of the orbit. The dotted line is same as the best-fit model but with an inclination i = 90°, corresponding to an edge-on view of the orbit in which the two components periodically eclipse each other. Thedot-dashed line indicates the same as the best-fit model with an argument of the periastron of 90°. Bottom panel: the solid line indicates the best-fit model. The dashed line is the same as the best-fit model but with a secondary of Mbol = −1. The dotted line indicates the best-fit model with eccentricity e = 0.1. the dot-dashed line indicates the same as best-fit model but with a secondary with Teff = 20 000 K.
Current usage metrics show cumulative count of Article Views (full-text article views including HTML views, PDF and ePub downloads, according to the available data) and Abstracts Views on Vision4Press platform.
Data correspond to usage on the plateform after 2015. The current usage metrics is available 48-96 hours after online publication and is updated daily on week days.
Initial download of the metrics may take a while.