Fig. 9
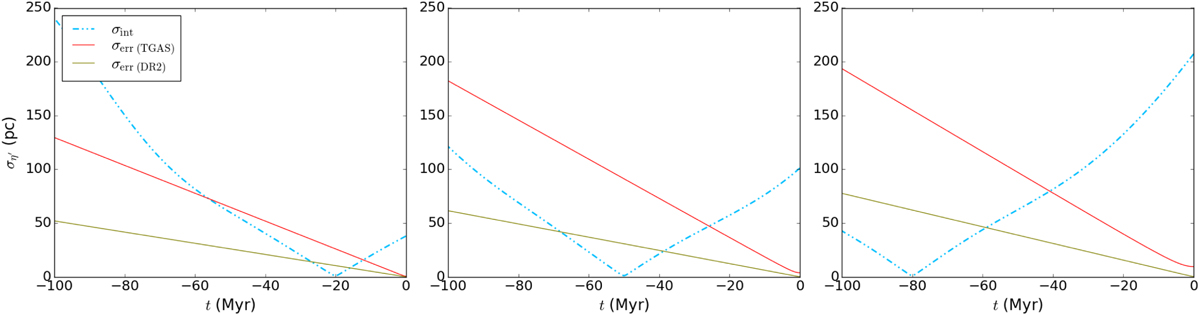
Evolution of the intrinsic dispersion (cyan dot-dashed lines) and the dispersion due to observational errors in the η′ coordinate for a simulated YLA following orbit-1 of 20, 50, and 80 Myr (from left to right) with initial conditions IC-1. Two different data scenarios are considered, namely TGAS (red solid lines) and DR2 (olive solid lines).
Current usage metrics show cumulative count of Article Views (full-text article views including HTML views, PDF and ePub downloads, according to the available data) and Abstracts Views on Vision4Press platform.
Data correspond to usage on the plateform after 2015. The current usage metrics is available 48-96 hours after online publication and is updated daily on week days.
Initial download of the metrics may take a while.