Fig. 8
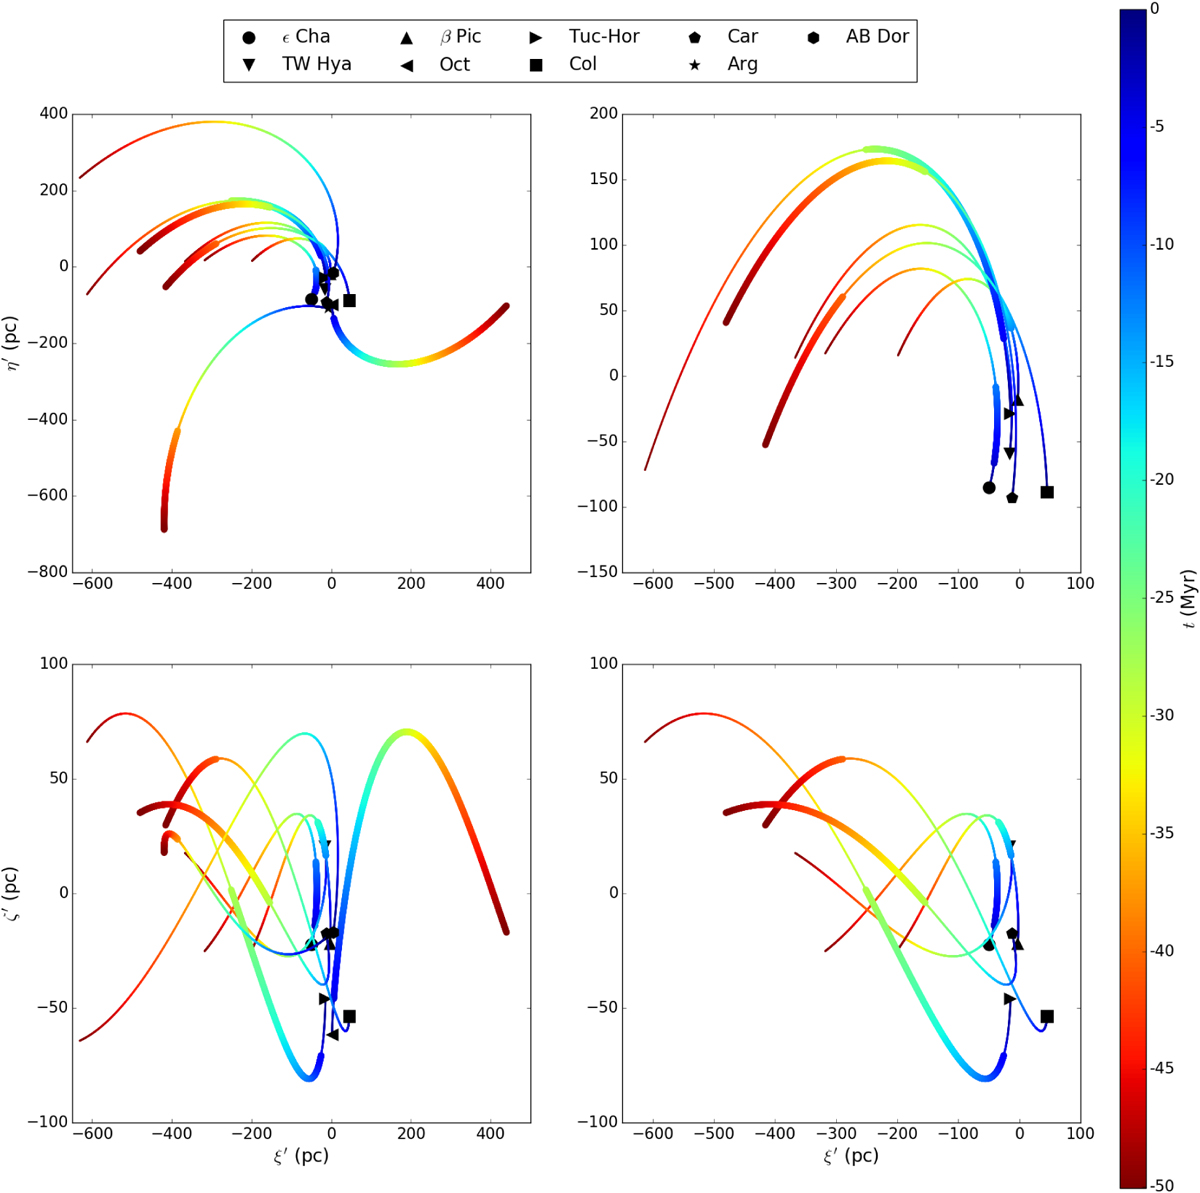
Curvilinear heliocentric (ξ′, η′) projection (top) and (ξ′, ζ′) (bottom), colour-coded as a function of time, of the orbits of the centroids of the associations considered in this study (Table 1). The panels on the right are a zoom of the panels on the left, removing the Octans, Argus, and AB Dorassociations (see text). The larger dots mark the region where the associations are formed according to our dynamical age determination ranges from Table 3.
Current usage metrics show cumulative count of Article Views (full-text article views including HTML views, PDF and ePub downloads, according to the available data) and Abstracts Views on Vision4Press platform.
Data correspond to usage on the plateform after 2015. The current usage metrics is available 48-96 hours after online publication and is updated daily on week days.
Initial download of the metrics may take a while.