Fig. 7
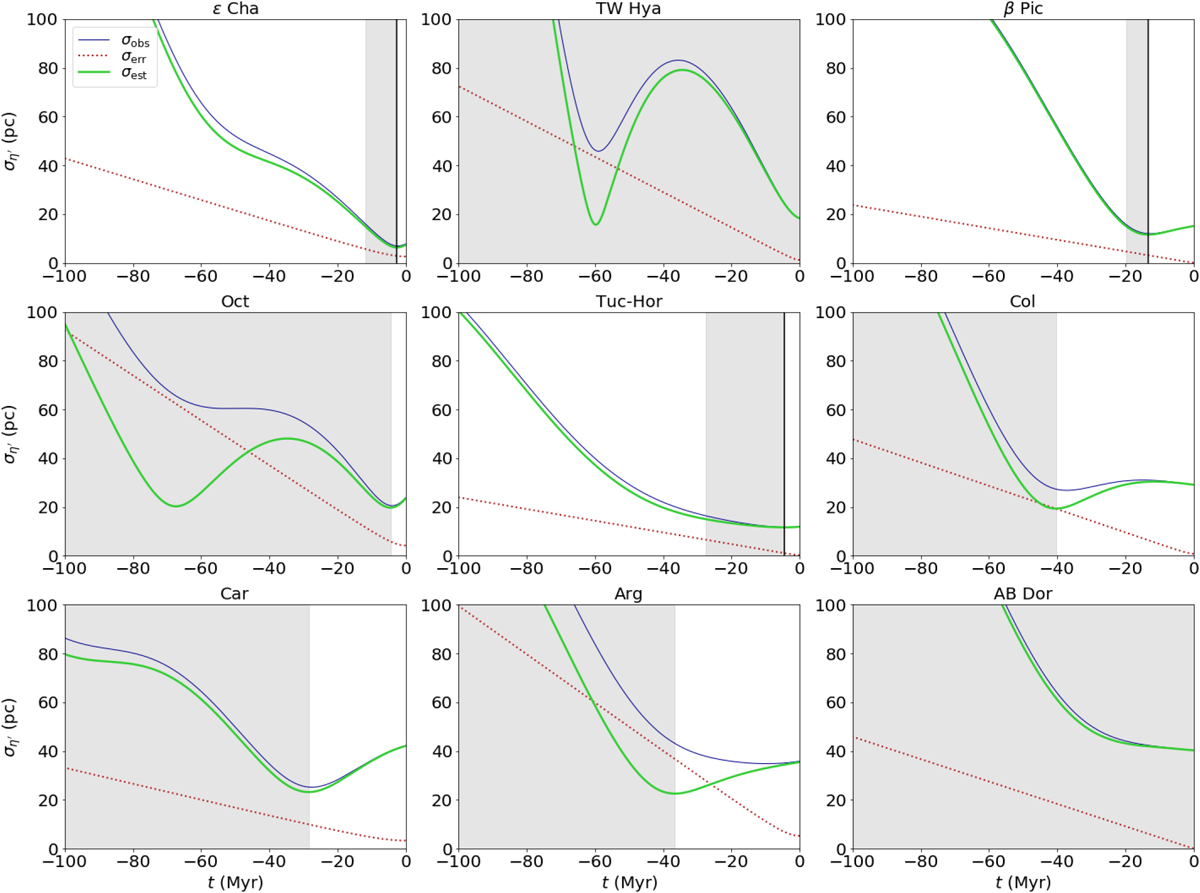
Evolution with time of the dispersions in η′ coordinate for the observed associations presented in Table 1. We show the propagated observed σobs (dark blue solid lines), dispersion due to observational errors σerr (red dotted lines), and estimated intrinsic dispersion σest (green thick solid lines). The grey shaded areas represent the region of uncertainty of the dynamical age.
Current usage metrics show cumulative count of Article Views (full-text article views including HTML views, PDF and ePub downloads, according to the available data) and Abstracts Views on Vision4Press platform.
Data correspond to usage on the plateform after 2015. The current usage metrics is available 48-96 hours after online publication and is updated daily on week days.
Initial download of the metrics may take a while.