Fig. 5
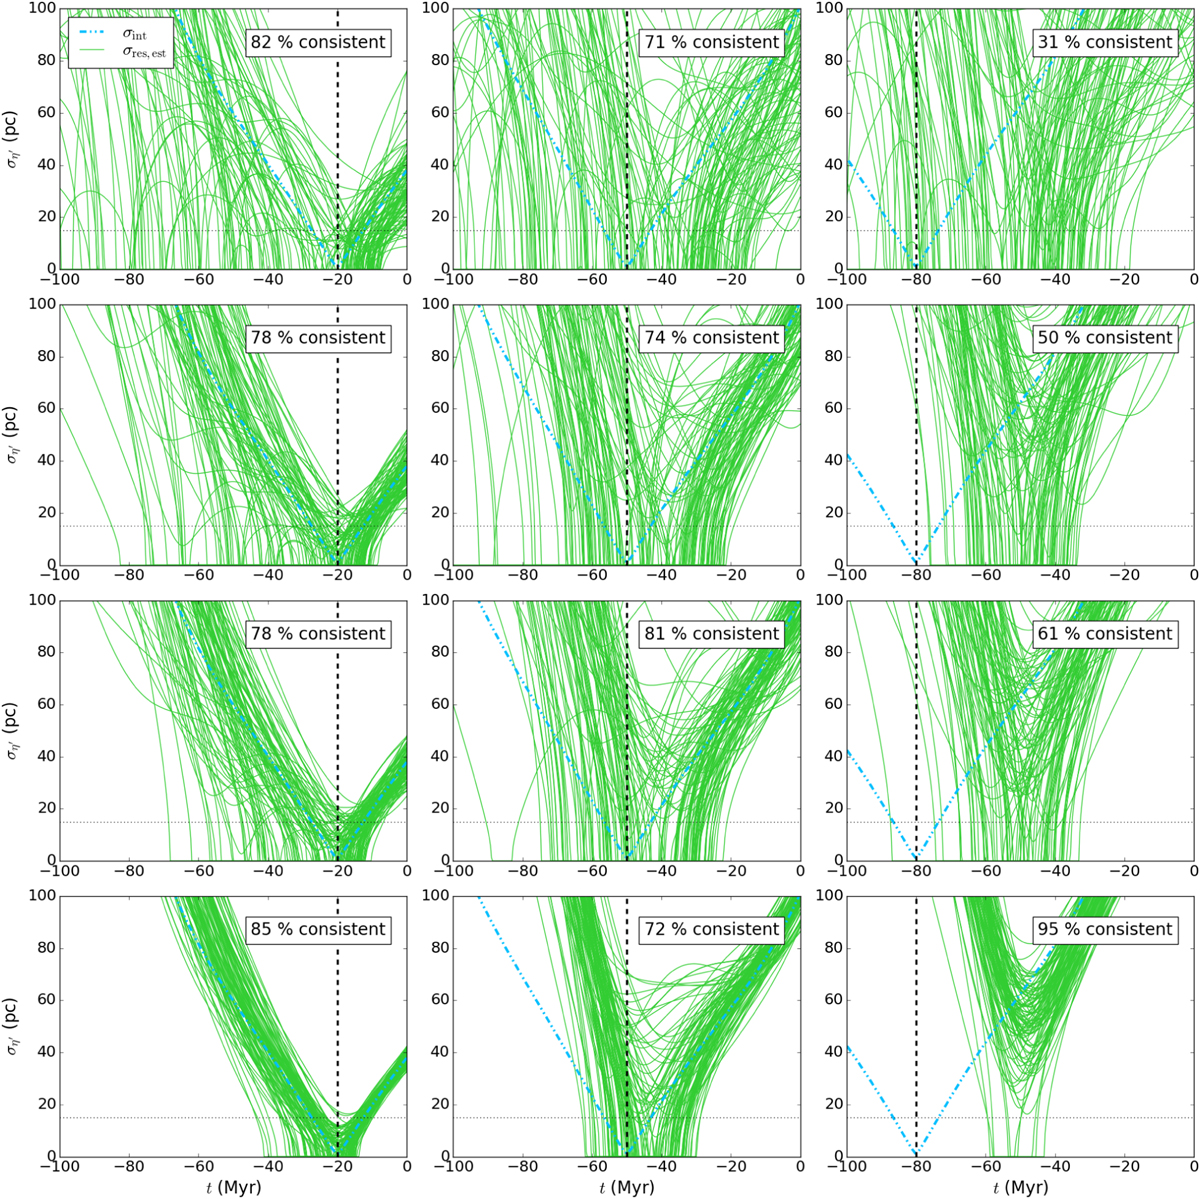
Evolution in time of the dispersion in the η′ coordinate for a simulated YLA using a resampling technique where we only consider (from top to bottom) 5, 15, 25, and 100 members of the 500 members of the association. The initial conditions are IC-1 with orbit-1 and ages (from left to right) of 20,50, and 80 Myr (marked with a vertical black dashed line). The different lines are the intrinsic dispersion (σint, cyan dot-dashed line) and the estimated intrinsic dispersion of each of the 100 trials (σres,est, green solid lines). In each panel, we indicate the percentage of success in determining the dynamical age.
Current usage metrics show cumulative count of Article Views (full-text article views including HTML views, PDF and ePub downloads, according to the available data) and Abstracts Views on Vision4Press platform.
Data correspond to usage on the plateform after 2015. The current usage metrics is available 48-96 hours after online publication and is updated daily on week days.
Initial download of the metrics may take a while.