Fig. A.1
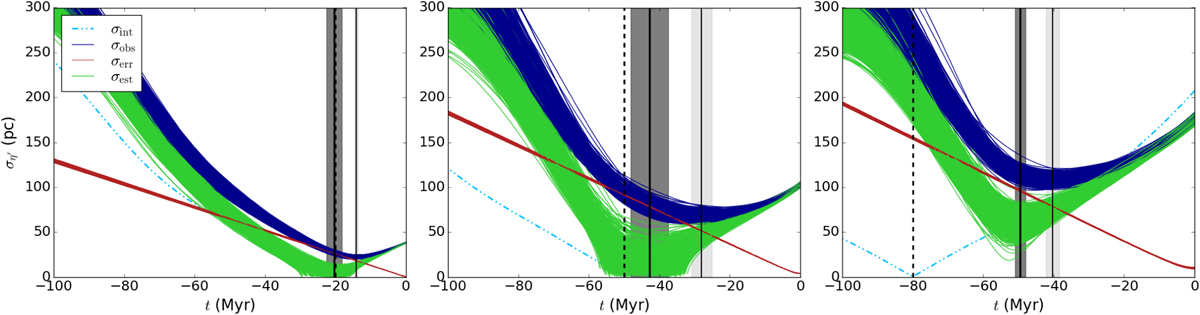
Evolution in time of the dispersion in the η′ coordinate for a simulated YLA with initial conditions IC-1 and following orbit-1 (from left to right) with ages of 20, 50, and 80 Myr (marked with a vertical black dashed line) with 1000 Monte Carlo realisations of the observational errors. The different lines are the intrinsic dispersion (σint, cyan dot-dashed line), the propagated observed dispersion for each Monte Carlo realisation (σobs, dark blue solid lines), the dispersion due to observational errors (σerr, red lines), and the estimated intrinsic dispersion (σest, green solid lines). The light grey shaded region represents the uncertainty in the dynamical age determined with the propagated observed dispersion, and the dark grey shaded region represents the uncertainty in the dynamical age determined with the estimated dispersion.
Current usage metrics show cumulative count of Article Views (full-text article views including HTML views, PDF and ePub downloads, according to the available data) and Abstracts Views on Vision4Press platform.
Data correspond to usage on the plateform after 2015. The current usage metrics is available 48-96 hours after online publication and is updated daily on week days.
Initial download of the metrics may take a while.