Fig. 8
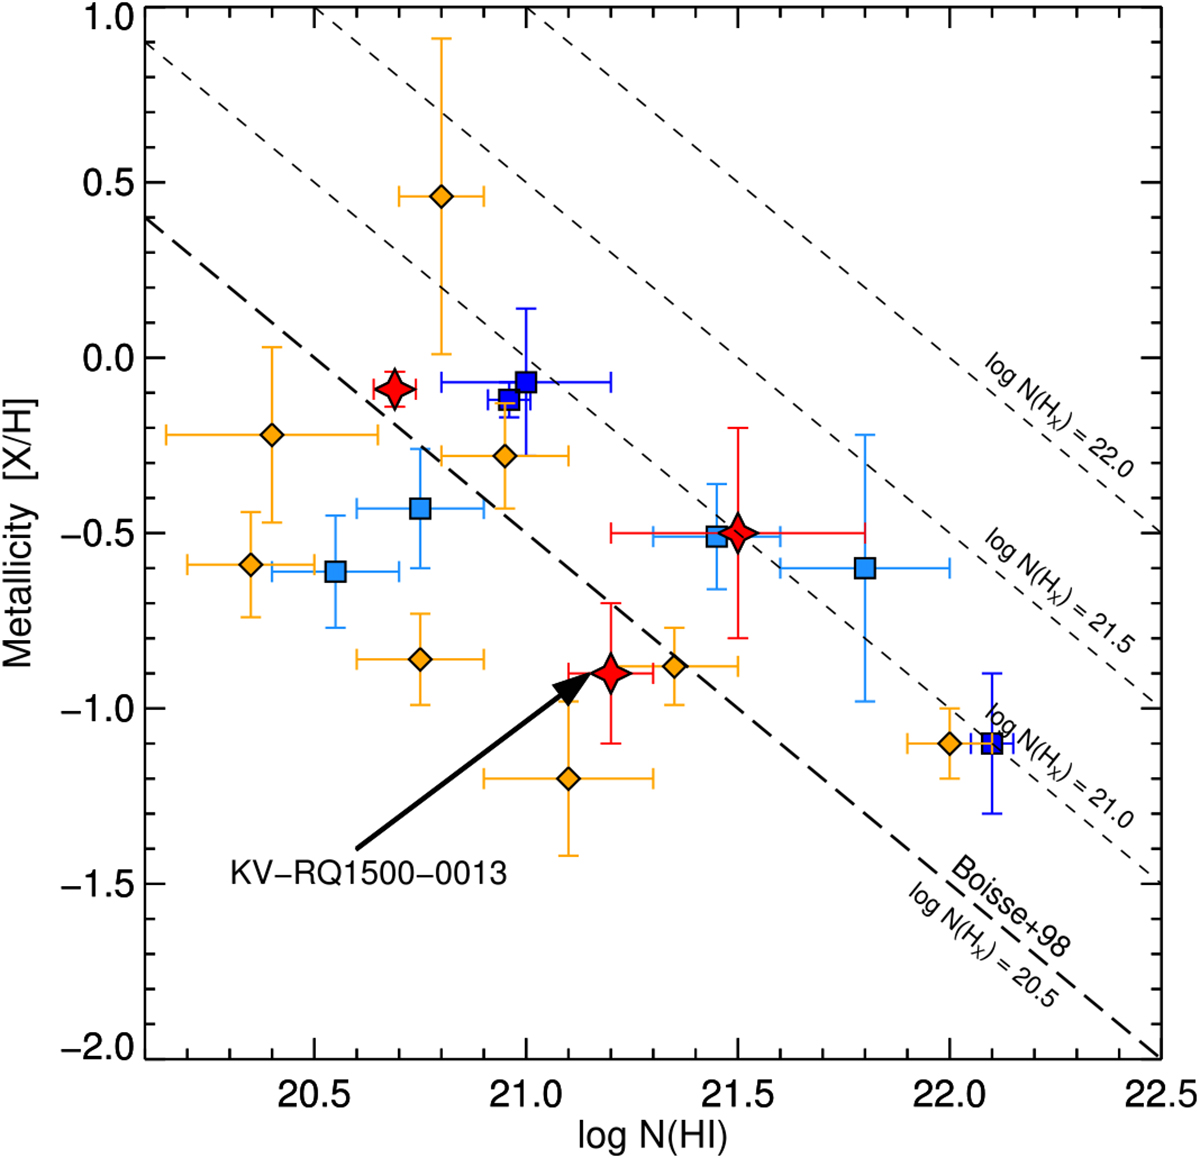
Metallicity as a function of H I column density of the dusty QSO-DLAs. The colored symbols show the specific selection of the background quasars (see Fig. 7). Overplotted is again the Boissé et al. (1998) line corresponding to logN(HX) = 20.5, shown together with the dashed lines representing metal column densities of log N(HX) = 21.0, 21.5, and 22.0, respectively.
Current usage metrics show cumulative count of Article Views (full-text article views including HTML views, PDF and ePub downloads, according to the available data) and Abstracts Views on Vision4Press platform.
Data correspond to usage on the plateform after 2015. The current usage metrics is available 48-96 hours after online publication and is updated daily on week days.
Initial download of the metrics may take a while.