Fig. 7
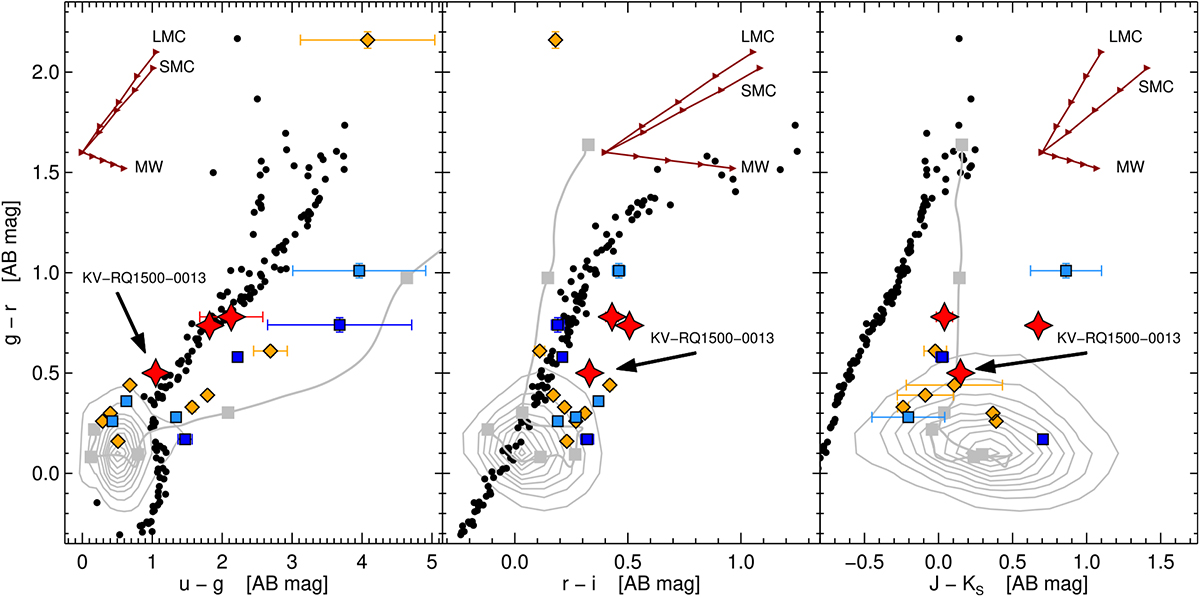
Effect of dust on optical/near-infrared quasar colors. Only a subset of the dusty QSO-DLAs have near-infrared colors from either 2MASS or UKIDSS. We show where the bulk of the SDSS-DR12 quasar population at 1.5 < z < 4.0 is located in g − r versus u–g, r–i, and J–KS colors as thegray contours. For illustration purposes we model a redshift track of a composite quasar template (gray solid line) in steps of Δz = 0.5 starting from z = 1.5 to z = 4.0, each step shown by the gray squares. The black dots denote the colors of standard, main-sequence stars from Hewett et al. (2006). Also shown are reddening vectors for a simple system with a DLA at zabs = 2.5 and a quasarat zQSO = 3.0, in steps of AV = 0.25, 0.50, 0.75, and 1.00 mag (red arrows). The dusty QSO-DLAs are overplotted and color-coded as a function of how their underlying background quasars were selected. Red star symbols denote the quasars that were misclassified as stars in SDSS but identified in the HAQ and KV-RQ surveys, blue squares show the sources photometrically selected to be quasars in the SDSS (light) and BOSS (dark) surveys, and orange diamonds denote sources that were observed as part of the SDSS and BOSS surveys but were selected as, e.g., filler or radio sources.
Current usage metrics show cumulative count of Article Views (full-text article views including HTML views, PDF and ePub downloads, according to the available data) and Abstracts Views on Vision4Press platform.
Data correspond to usage on the plateform after 2015. The current usage metrics is available 48-96 hours after online publication and is updated daily on week days.
Initial download of the metrics may take a while.