Fig. 5
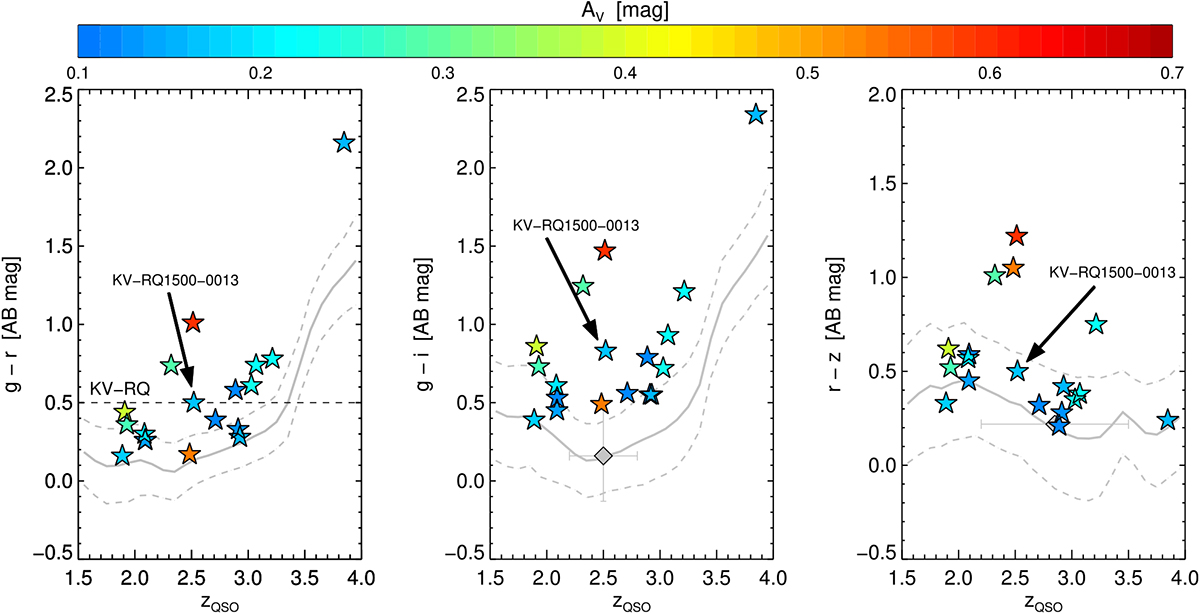
Optical colors color-coded as a function of visual extinction, AV, versus quasar emission redshift for the dusty QSO-DLAs presented here and the average quasar colors from the SDSS-DR12Q sample. The solid gray lines denotes the SDSS-DR12Q sample median and the dashed lines show one standard deviation away from the median. The colored symbols show the individual broad-band colors, g–r, g–i, and r–z, of the dusty QSO-DLAs. For comparison, the strongest KV-RQ selection criteria (g–r > 0.5) is shown in the left panel as the dashed, black line, the mean g–i color excess of DLAs from SDSS-DR7 derived by Khare et al. (2012) is shown in the middle panel, and the mean r–z color excess of DLAs from SDSS-DR5 derived by Vladilo et al. (2008) is shown in the right panel (both as large gray diamonds). The horizontal errors denote the redshift span of the DLAs in each of the two SDSS-based samples. It is clear that the dusty absorbers cause an increased reddening in the optical colors, in general as a function of their extinction.
Current usage metrics show cumulative count of Article Views (full-text article views including HTML views, PDF and ePub downloads, according to the available data) and Abstracts Views on Vision4Press platform.
Data correspond to usage on the plateform after 2015. The current usage metrics is available 48-96 hours after online publication and is updated daily on week days.
Initial download of the metrics may take a while.