Fig. 3
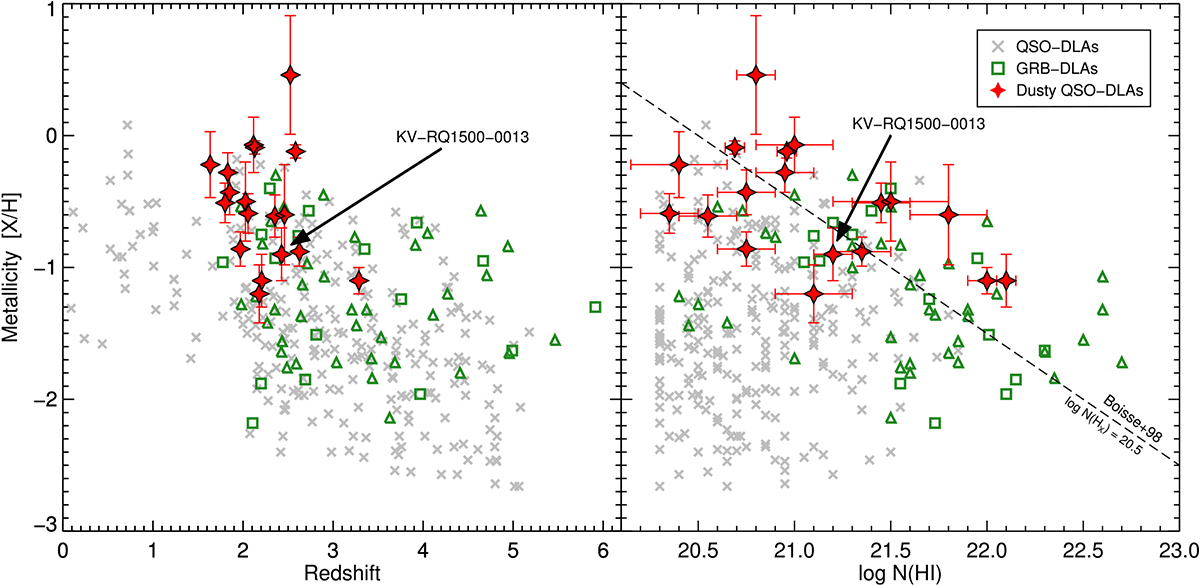
Metallicity evolution with redshift of the DLA samples (left panel) and as a function of H I column densities, log N(H I), (right panel). The typical QSO-DLAs with metallicities from the literature are shown as gray crosses, the GRB-DLAs as green squares (exact values) and upward triangles (lower limits) and the dusty QSO-DLAs from our sample are shown as red star symbols. The dusty QSO-DLAs reveal a higher average mean metallicity compared to all QSO-DLAs. About two thirds of the dusty QSO-DLAs exceed the apparent demarcation line proposed by Boissé et al. (1998), corresponding to log N(HX) ≡ log N(H I) + [X/H] = 20.5 cm−2, above whichthe detection probability of QSO-DLAs is hampered due to dust obscuration of the underlying quasars.
Current usage metrics show cumulative count of Article Views (full-text article views including HTML views, PDF and ePub downloads, according to the available data) and Abstracts Views on Vision4Press platform.
Data correspond to usage on the plateform after 2015. The current usage metrics is available 48-96 hours after online publication and is updated daily on week days.
Initial download of the metrics may take a while.