Fig. 1
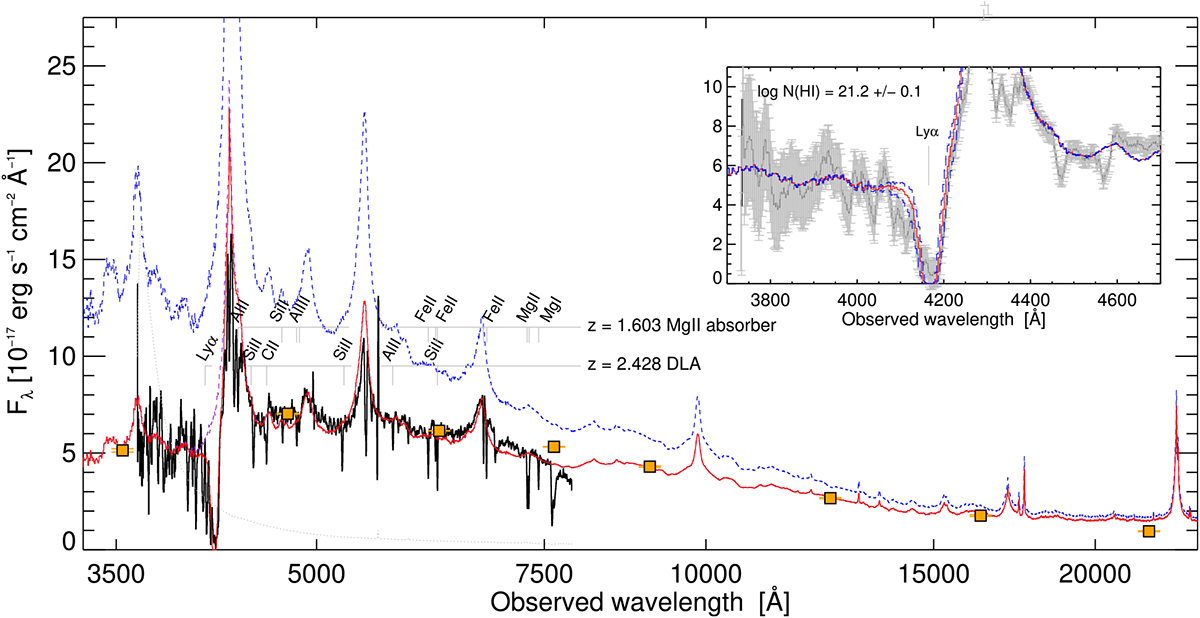
GTC spectrum taken with the R1000B grism shown as the solid black line together with the optical/near-infrared photometry in the u, g, r, i, Z, Y, J, H, and Ks bands from KiDS and VIKING overplotted as orange squares. The error spectrum is shown as the gray dotted line. In blue is shown a composite quasar template and in red the same composite but reddened by AV = 0.16 mag in the rest frame of the DLA with the model DLA imposed on the template. The purple line shows the reddened template without the DLA. In the inset we zoom in on the spectral region covering the Lyα absorption line of the DLA at zDLA = 2.4284 and show the model with the best-fit H I column density and associated error of log N(H I) = 21.2 ±0.1 as the red solid and blue dashed lines respectively.
Current usage metrics show cumulative count of Article Views (full-text article views including HTML views, PDF and ePub downloads, according to the available data) and Abstracts Views on Vision4Press platform.
Data correspond to usage on the plateform after 2015. The current usage metrics is available 48-96 hours after online publication and is updated daily on week days.
Initial download of the metrics may take a while.