Fig. 6
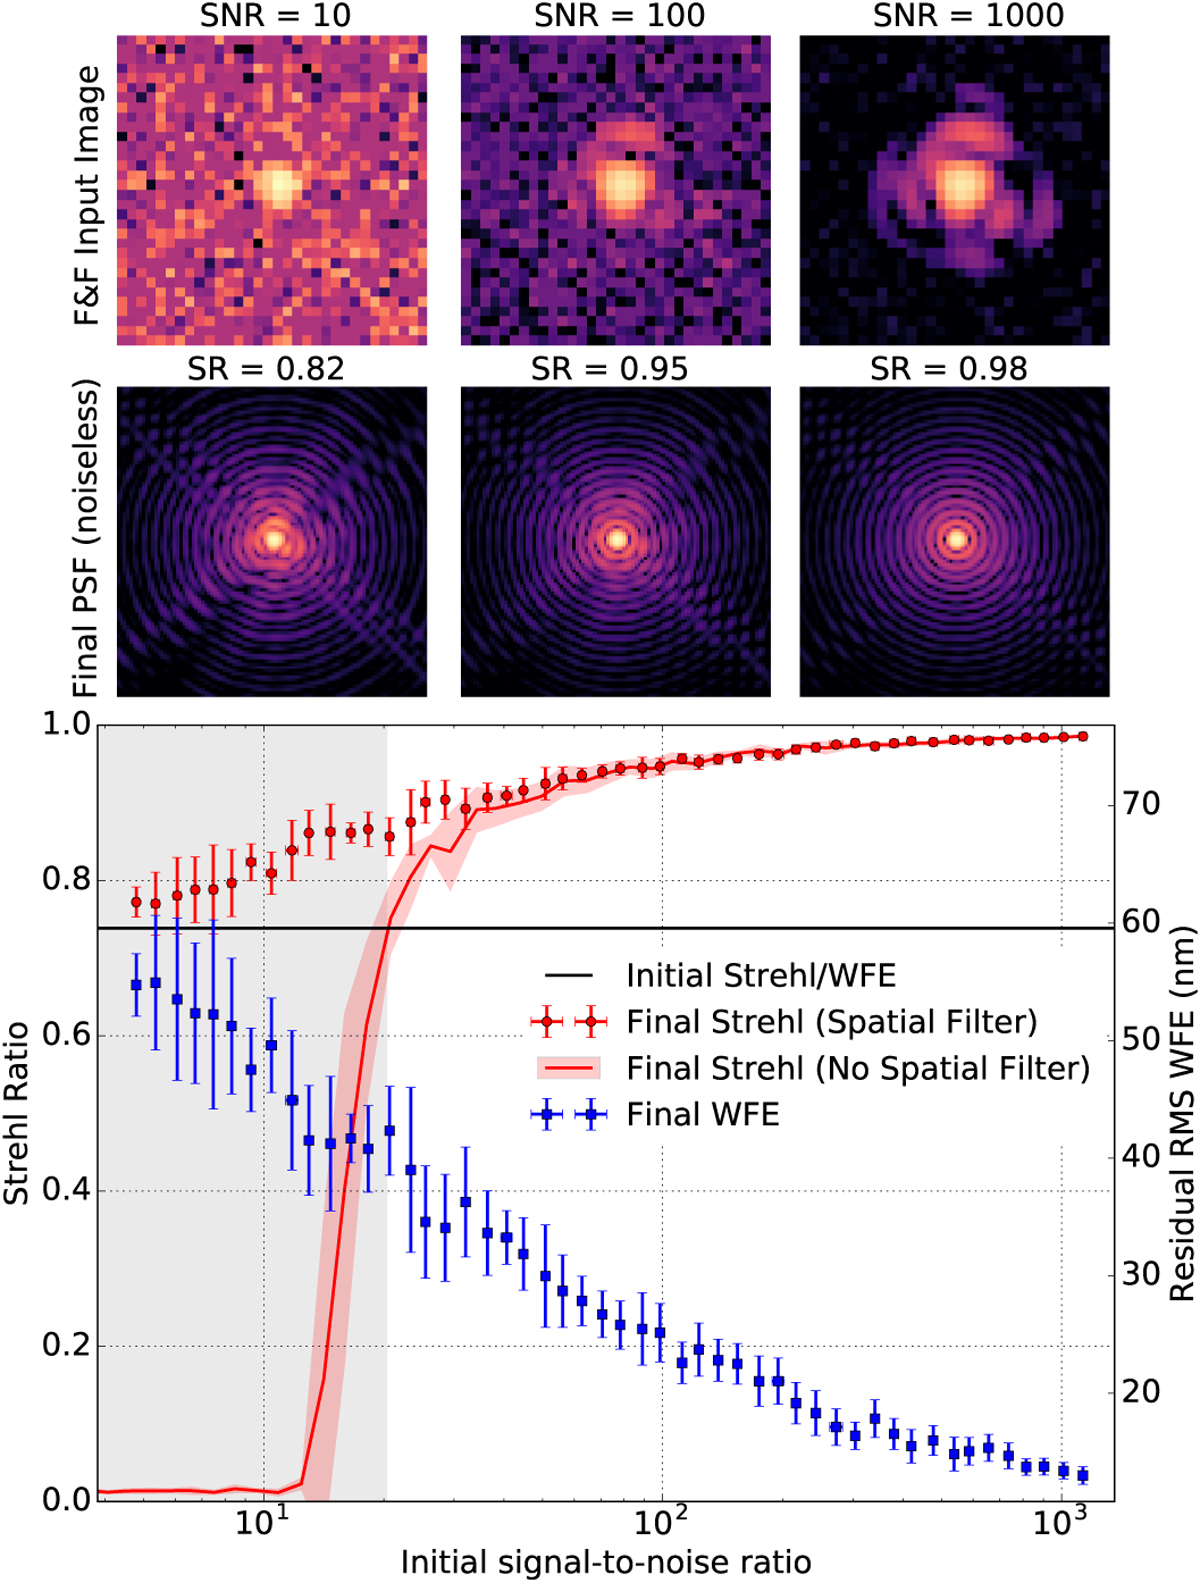
Simulated convergence quality of F&F as a function of image S/N, for half-wave (319 nm) PVE LWE at awavelength of 677 nm. Top image row: Initial DTTS images at specific S/N, showing increasing visibility of the aberrated first Airy ring. Bottom image row: Final noiseless images after 25 F&F iterations, showing acorresponding improvement in final PSF quality. Main panel: Plot of final Strehl ratio (red) and residual RMS wavefront error (blue) as a function of initial S/N. Each point is the average of ten simulations. The black horizontal line denotes both the starting Strehl ratio and wavefront error RMS, of 74% and 59 nm respectively. The shaded red line shows the Strehl ratio behaviour for F&F using the full 32 × 32 pixel DTTS image as input (i.e. without an adaptive spatial filter), with the shaded region below S∕N = 20 denoting the region where this implementation diverges.
Current usage metrics show cumulative count of Article Views (full-text article views including HTML views, PDF and ePub downloads, according to the available data) and Abstracts Views on Vision4Press platform.
Data correspond to usage on the plateform after 2015. The current usage metrics is available 48-96 hours after online publication and is updated daily on week days.
Initial download of the metrics may take a while.