Fig. 5
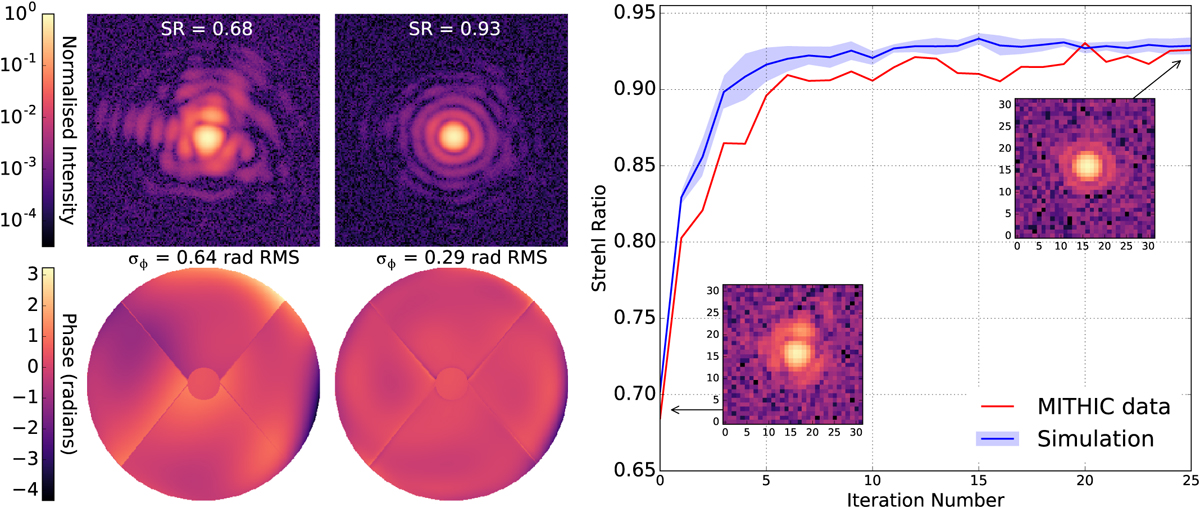
Comparison of F&F convergence behaviour between MITHIC laboratory data and equivalent simulations (see Table 1, row 1 for details). Left: high-resolution, high-S/N MITHIC focal-plane images (top) andcorresponding residual wavefront error maps (bottom), before and after F&F correction (first and second columns respectively). High-frequency residuals visible in the final wavefront error map are dominated by fitting error enforced by the DM-like filtering of wavefront corrections. Right: plot of estimated image Strehl ratio as a function of closed-loop iteration number, showing close agreement between a single convergence of MITHIC data (red) and an average of ten simulations (blue), with shading denoting the 1σ limit. The two inset images show the N = 0 and N = 25 DTTS-like input focal-plane images provided for F&F for wavefront reconstruction.
Current usage metrics show cumulative count of Article Views (full-text article views including HTML views, PDF and ePub downloads, according to the available data) and Abstracts Views on Vision4Press platform.
Data correspond to usage on the plateform after 2015. The current usage metrics is available 48-96 hours after online publication and is updated daily on week days.
Initial download of the metrics may take a while.