Fig. 4
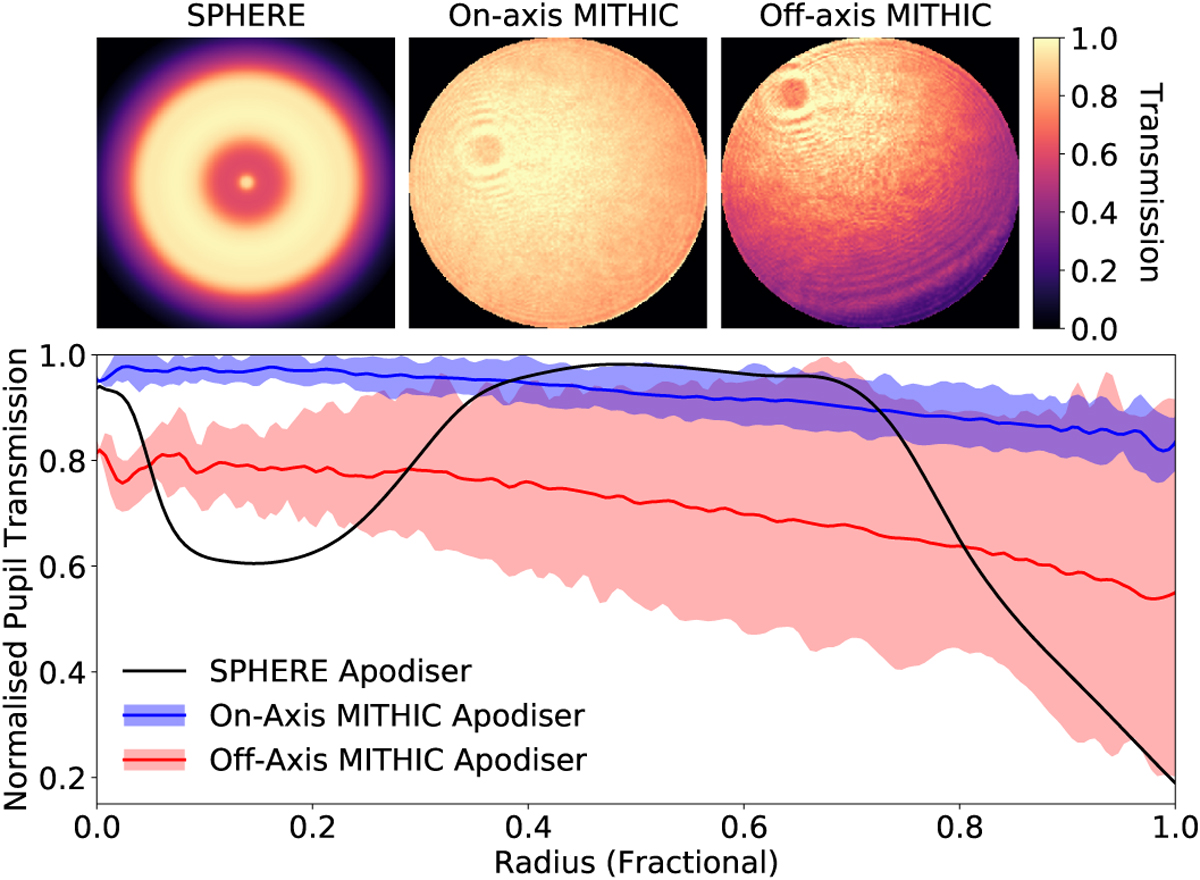
Throughput images (top panels) and radial transmission profiles (lower panel) of the amplitude apodisers relevant to this investigation. Top row, from left: SPHERE APLC apodiser model of Guerri et al. (2011), and pupil-imaging measurements of the on-axis and off-axis transmission (respectively) of the weak MITHIC bench apodiser. Lower panel: Dark lines denote the mean radial throughput curve of each transmission profile, with shading illustrating the maximum and minimum bounds in the azimuthal direction.
Current usage metrics show cumulative count of Article Views (full-text article views including HTML views, PDF and ePub downloads, according to the available data) and Abstracts Views on Vision4Press platform.
Data correspond to usage on the plateform after 2015. The current usage metrics is available 48-96 hours after online publication and is updated daily on week days.
Initial download of the metrics may take a while.