Fig. 1
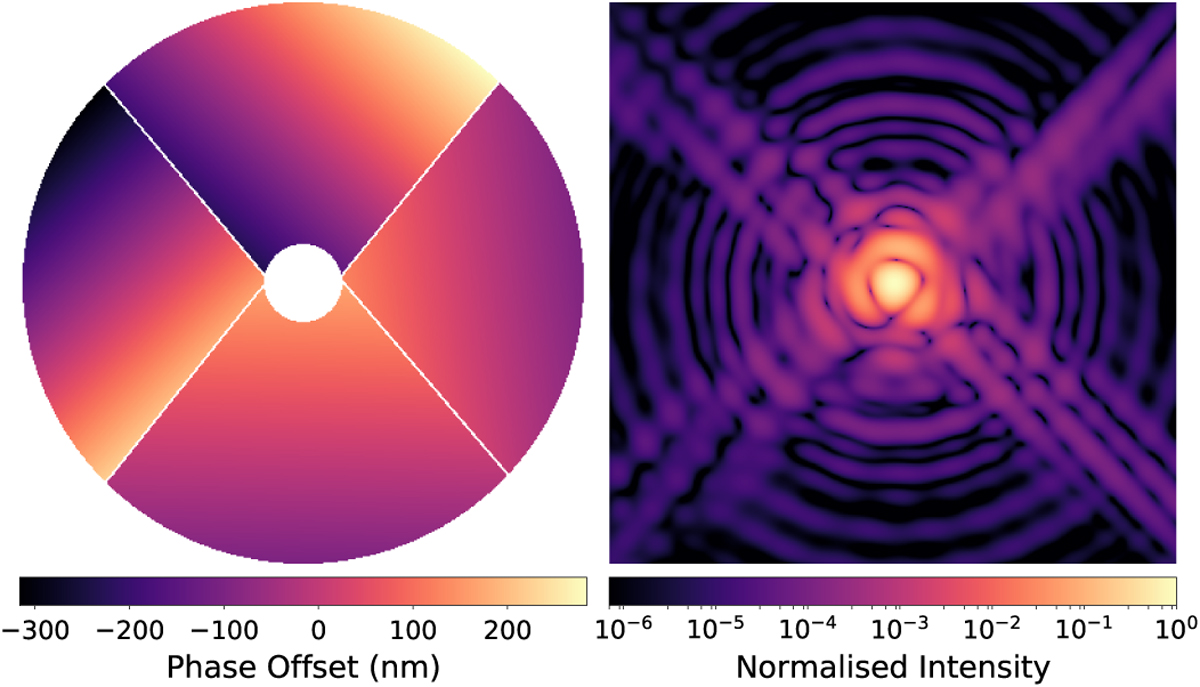
Typical example of the LWE phenomenon, based on on-sky measurements made with the ZELDA wavefront sensor. Left: parametrised PTT wavefront model based on a single ZELDA phase measurement. Right: the aberrated PSF corresponding to this LWE wavefront map, simulated at a wavelength of 1.536 μ m. The PSF displays three notable side-lobes at the location of the first Airy ring (2.5 λ∕D), which correspond to the differential tip-tilt components seen across individual pupil segments in the aberrating phase map.
Current usage metrics show cumulative count of Article Views (full-text article views including HTML views, PDF and ePub downloads, according to the available data) and Abstracts Views on Vision4Press platform.
Data correspond to usage on the plateform after 2015. The current usage metrics is available 48-96 hours after online publication and is updated daily on week days.
Initial download of the metrics may take a while.