Fig. 6
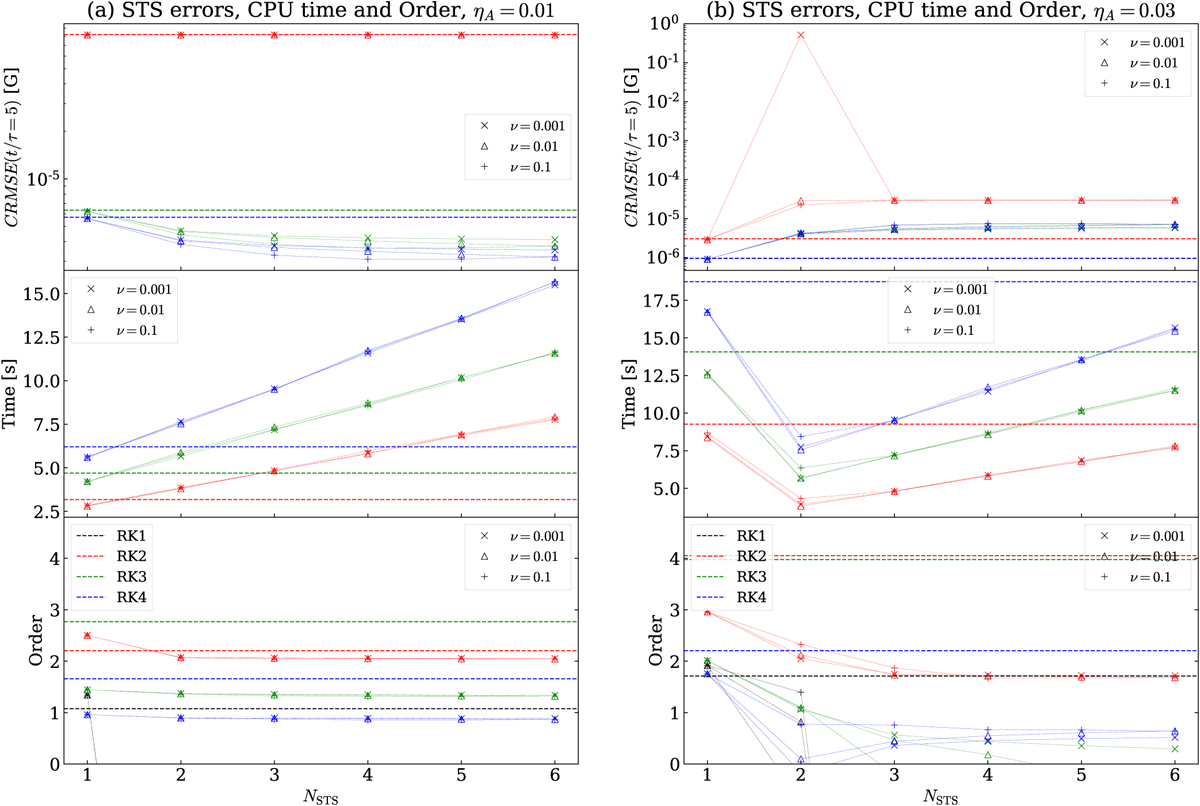
Upper panel: CRMSE values at t = 5τ s for different values of the pair (NSTS, ν). The horizontal dashed lines corresponds to the RK scheme values. The symbols correspond to the STS scheme, each of them indicate a different value of ν. The black, red, green and blue colours indicate first, second, third and fourth order accuracy respectively. The dotted lines linking the symbols are drawn just to make the plot more readable. Middle panel: CPU time spend by the schemes to reach the same point in the simulations. The colour and symbol code is the same as the upper panel. Lower panel: order computed using the L1 -norm at t0 = 0.7τ, see the dotted vertical line in Fig. 5; again, the colour and symbol code is the same as the upperpanel. In subfigure (a), we have a case with low ambipolar diffusion where the first order results unstable and the errors for the STS scheme are very close to the RK values. In this case, we have no acceleration because the system is out of the STS regime and the time increase linearly with NSTS as expected.
Current usage metrics show cumulative count of Article Views (full-text article views including HTML views, PDF and ePub downloads, according to the available data) and Abstracts Views on Vision4Press platform.
Data correspond to usage on the plateform after 2015. The current usage metrics is available 48-96 hours after online publication and is updated daily on week days.
Initial download of the metrics may take a while.