Fig. 7
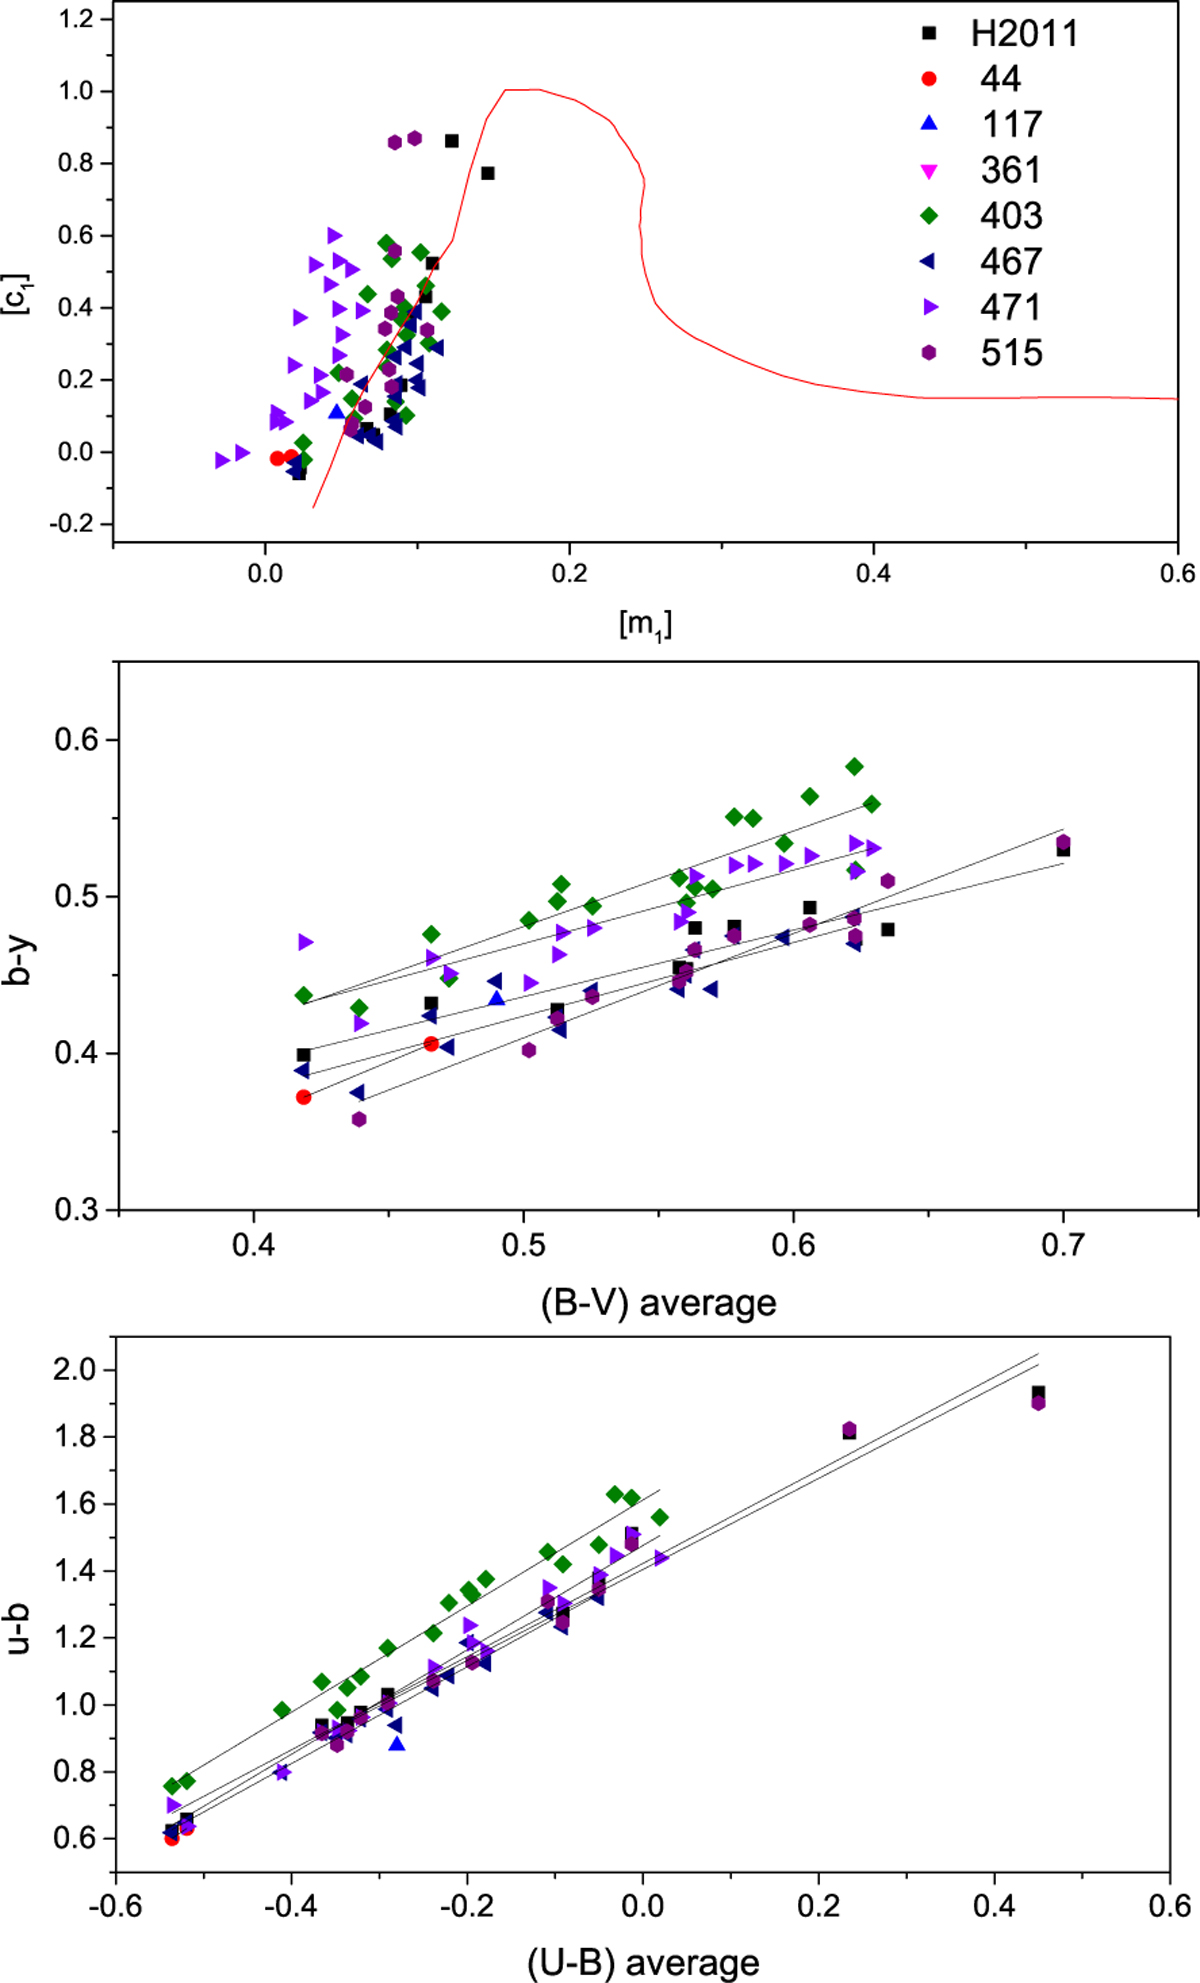
Top: classification [c1] vs. [m1] diagram for the stars earlier than A0 spectral type with available uvbyβ photometry. Different datasets are marked with different symbols, as indicated on the panel, using the WEBDA source identifications listed in Table 6. The solid line on this diagram represents the main sequence (Crawford 1975, 1978). Middle: comparisons of the average B − V to b − y from the individual sources. Bottom: similar comparisons for the U − B and u − b quantities. Linear fits corresponding to the different datasets are shown on the last two panels.
Current usage metrics show cumulative count of Article Views (full-text article views including HTML views, PDF and ePub downloads, according to the available data) and Abstracts Views on Vision4Press platform.
Data correspond to usage on the plateform after 2015. The current usage metrics is available 48-96 hours after online publication and is updated daily on week days.
Initial download of the metrics may take a while.