Fig. 6
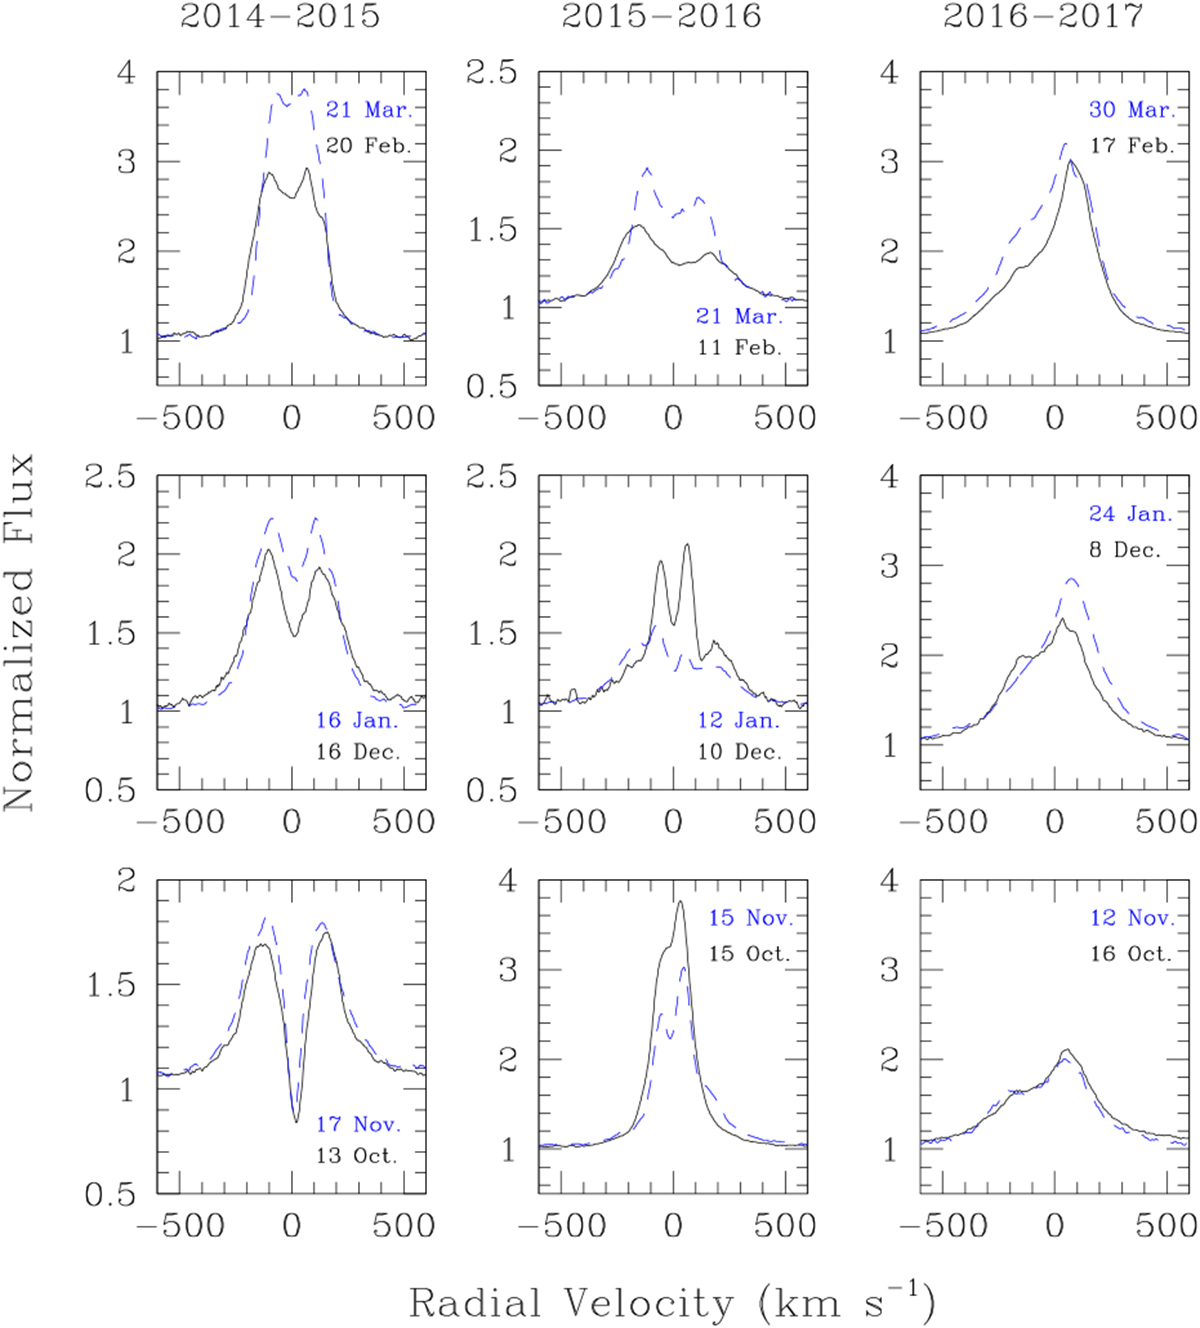
Variations of the Hα line profile of HD 45314 over the past three observing seasons, with one season per column (the visibility window for HD 45314 ranges from early October to end of March). In each column, the older spectra (i.e. Oct–Nov) can be found at the bottom and the most recent ones (i.e. Feb–Mar) are shown at the top. For each epoch, the panels show representative pairs of observations separated by about one month (the dates are indicated by the labels) with the older spectrum shown in black and the more recent one in blue. To enhance the visibility, the vertical scale of some of the panels was changed, but the x-axis limits remained the same.
Current usage metrics show cumulative count of Article Views (full-text article views including HTML views, PDF and ePub downloads, according to the available data) and Abstracts Views on Vision4Press platform.
Data correspond to usage on the plateform after 2015. The current usage metrics is available 48-96 hours after online publication and is updated daily on week days.
Initial download of the metrics may take a while.