Fig. 4
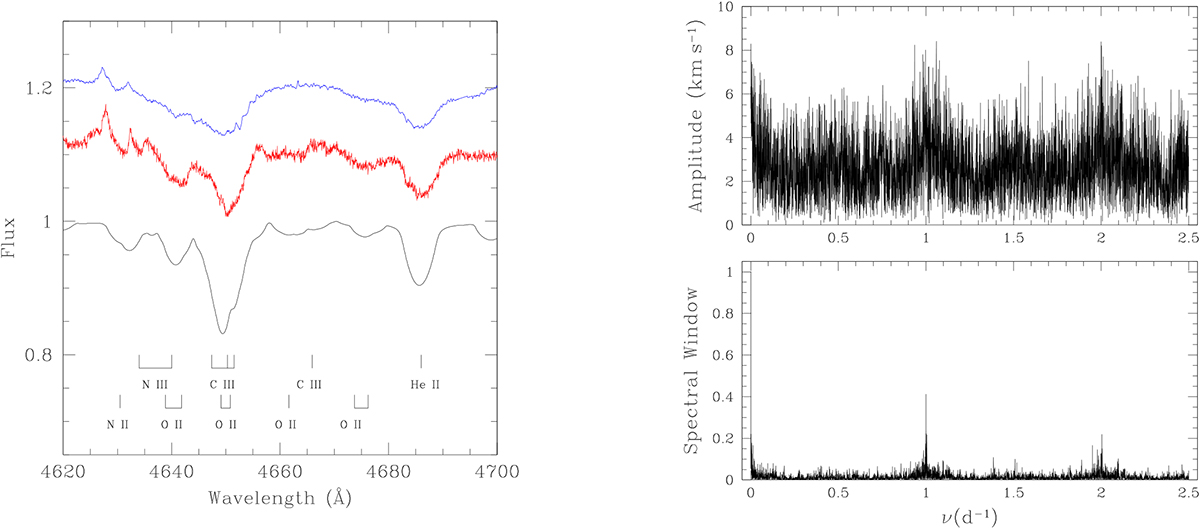
Left: Spectral region between 4620 and 4700 Å is shown in the synthetic spectrum (black line) as well as in two observations of HD 45314 taken with the FEROS instrument on HJD 2 452 336.596 (RV = 23.2 km s−1, red line, shifted upward by 0.1 continuum unit) and 2 453 739.585 (RV = − 18.6 km s−1, blue line, shifted upwards by 0.2 continuum unit). Right: Fourier analysis of the full sample of 87 RVs of HD 45314. The top panel illustrates the periodogram of the RVs, whilst the bottom panel provides the spectral window associated with our series ofdata.
Current usage metrics show cumulative count of Article Views (full-text article views including HTML views, PDF and ePub downloads, according to the available data) and Abstracts Views on Vision4Press platform.
Data correspond to usage on the plateform after 2015. The current usage metrics is available 48-96 hours after online publication and is updated daily on week days.
Initial download of the metrics may take a while.