Fig. 4.
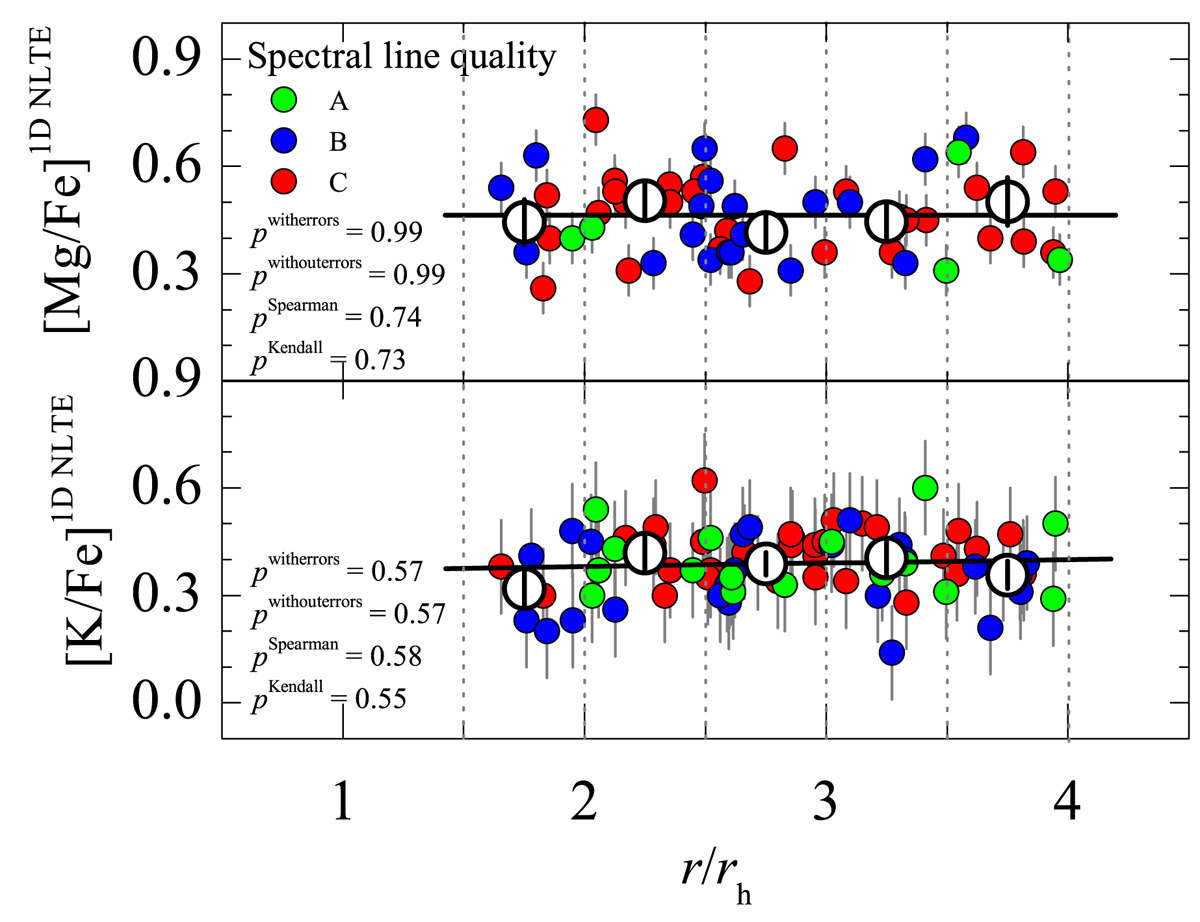
Abundance-to-iron ratios of Mg and K plotted versus the projected distance from the cluster center, r/rh (small filled circles; rh is a half-mass radius of 47 Tuc, rh = 174″, taken from Trager et al. 1993). Symbol color denotes quality (class) of the spectral lines from which the abundance was determined. Large open circles are average abundance ratios computed in non-overlapping Δr/rh = 1 wide distance bins (marked by the vertical dashed lines; RMS scatter of the abundance ratios in a given bin is shown by the black vertical error bars). Black solid lines are linear fits to the data of individual stars, with the p-values obtained using different tests (see text) marked in the corresponding panels.
Current usage metrics show cumulative count of Article Views (full-text article views including HTML views, PDF and ePub downloads, according to the available data) and Abstracts Views on Vision4Press platform.
Data correspond to usage on the plateform after 2015. The current usage metrics is available 48-96 hours after online publication and is updated daily on week days.
Initial download of the metrics may take a while.