Fig. 1.
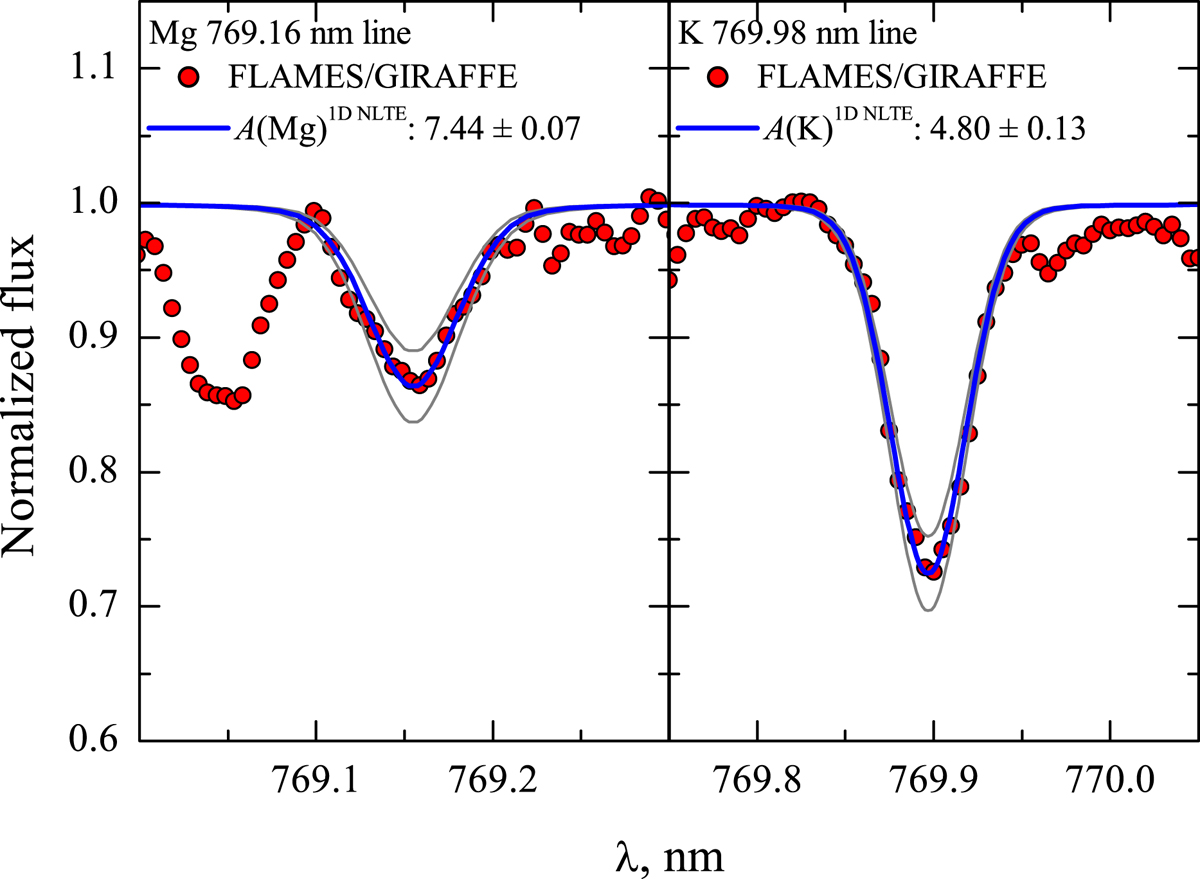
Typical fits of synthetic Mg and K line profiles (solid blue lines) to those in the observed GIRAFFE spectrum (filled red circles) of the target TO star 47Tuc45982 (Teff = 5707 K, log g = 4.00). We also provide the abundances determined from each observed line, A(X), together with their errors (see Sec. 2.3.4). Thin gray lines show synthetic line profiles computed with the abundances altered by ±0.2 dex.
Current usage metrics show cumulative count of Article Views (full-text article views including HTML views, PDF and ePub downloads, according to the available data) and Abstracts Views on Vision4Press platform.
Data correspond to usage on the plateform after 2015. The current usage metrics is available 48-96 hours after online publication and is updated daily on week days.
Initial download of the metrics may take a while.