Fig. 7
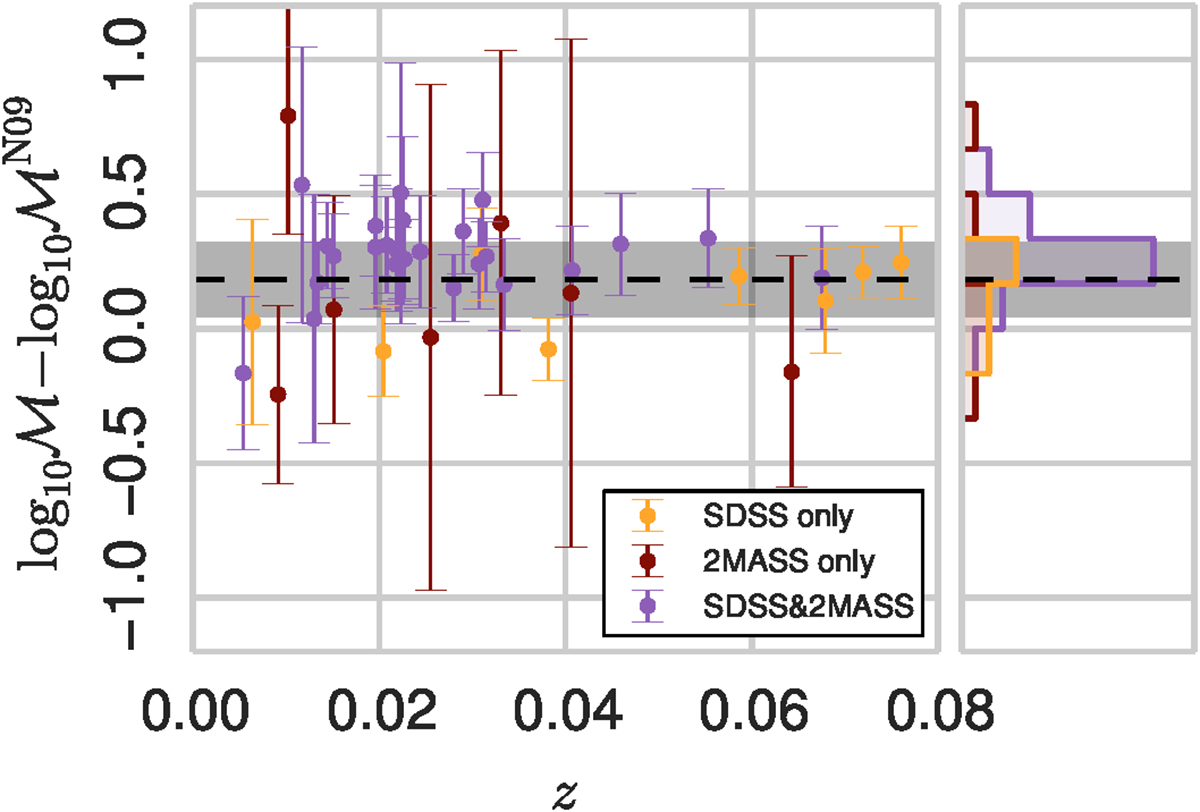
Redshift evolution of the differences in common host stellar mass between N09 and our sample. Galaxies with only SDSS-like photometry are represented in orange. Their masses are estimated by fitting the spectral series PEGASE to our observed ugriz magnitudes.Galaxies presenting photometry in the 2MASS survey alone are drawn in dark red, their masses are derived from K-band absolute magnitude through Eq. (6). Stellar mass differences of objects with both types of photometry are displayed in purple. For these galaxies, we present masses derived from ugriz observed magnitudes. The dashed black line corresponds to the mean difference, with the rms represented by the gray area.
Current usage metrics show cumulative count of Article Views (full-text article views including HTML views, PDF and ePub downloads, according to the available data) and Abstracts Views on Vision4Press platform.
Data correspond to usage on the plateform after 2015. The current usage metrics is available 48-96 hours after online publication and is updated daily on week days.
Initial download of the metrics may take a while.