Fig. 2
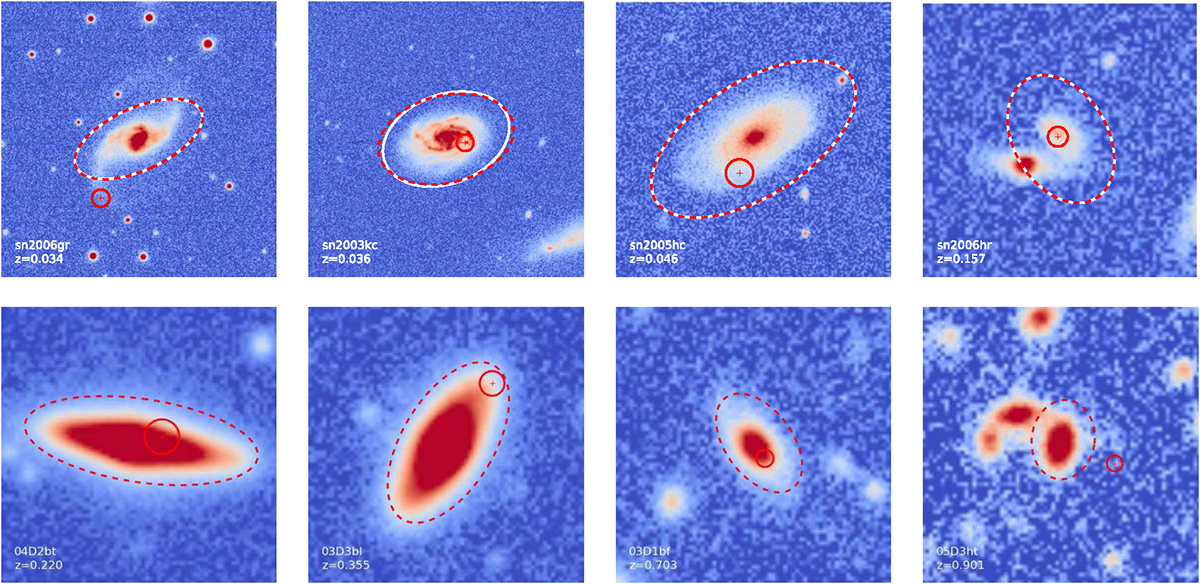
Examples of eight g-band images of SNIa host galaxies ordered in redshift. The top row corresponds to SDSS images with sn2006gr, sn2003kc, sn2005hc, and sn2006hr. For this survey, the dashed red and solid white ellipses represent the region where the global photometry is measured for a low and high level of deblending. The solid red circle symbolizes the 3 kpc region where the local photometry is computed. The second row displays SNLS images corresponding to 04D2bt, 03D3bl, 03D1bf, and 05D3ht, using one single SExtractor configuration. This illustrates the great variety of cases, from SNIa exploding in the inner galaxy core to SNIa observed far away from the center, in the galactic arms.
Current usage metrics show cumulative count of Article Views (full-text article views including HTML views, PDF and ePub downloads, according to the available data) and Abstracts Views on Vision4Press platform.
Data correspond to usage on the plateform after 2015. The current usage metrics is available 48-96 hours after online publication and is updated daily on week days.
Initial download of the metrics may take a while.