Free Access
Fig. 19
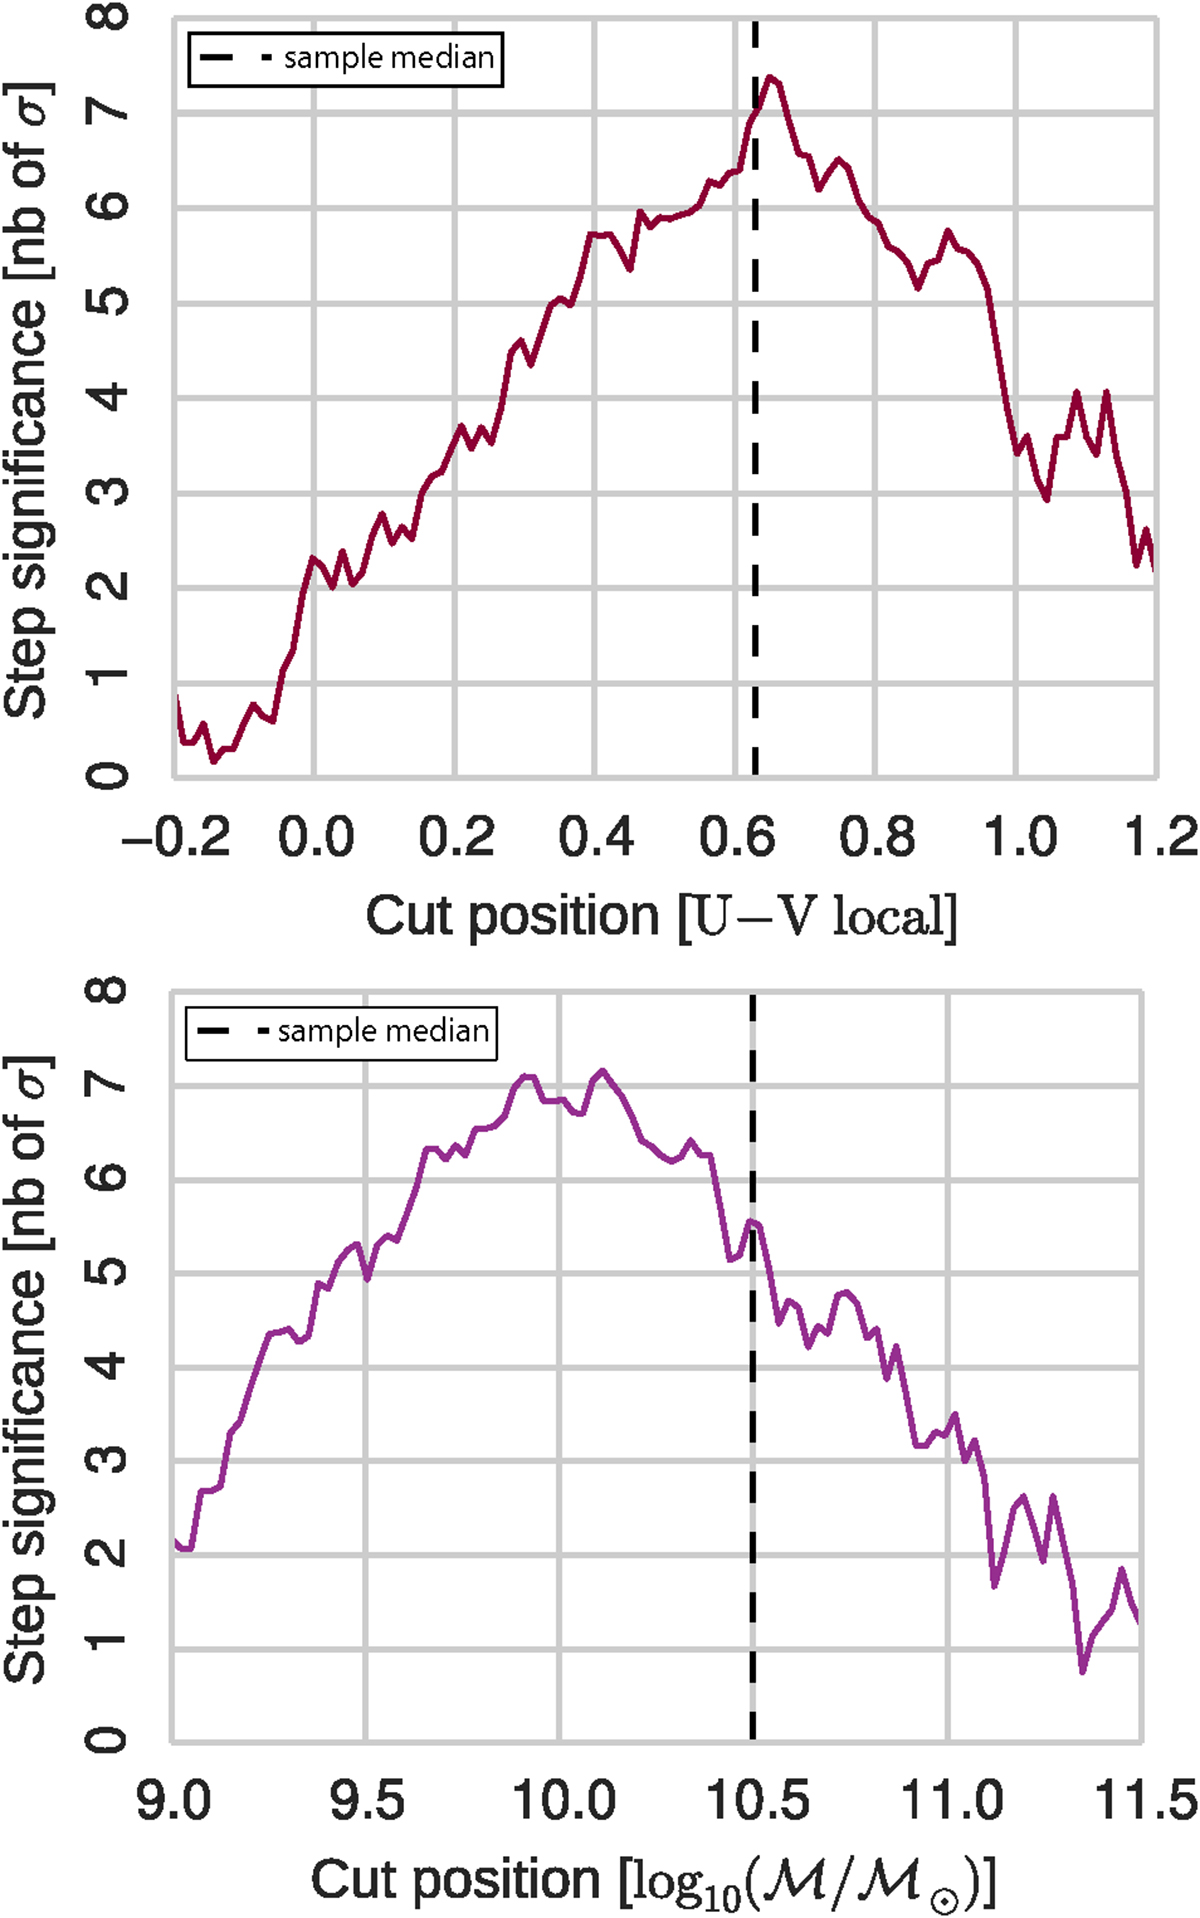
Top: evolution of local color step significance as a function of the position of the local U − V color cut. The position of the sample median, chosen for the basic analysis, is shown as the dashed black line. Bottom: same as the top panel, but for the stellar mass of the host.
Current usage metrics show cumulative count of Article Views (full-text article views including HTML views, PDF and ePub downloads, according to the available data) and Abstracts Views on Vision4Press platform.
Data correspond to usage on the plateform after 2015. The current usage metrics is available 48-96 hours after online publication and is updated daily on week days.
Initial download of the metrics may take a while.