Fig. 18
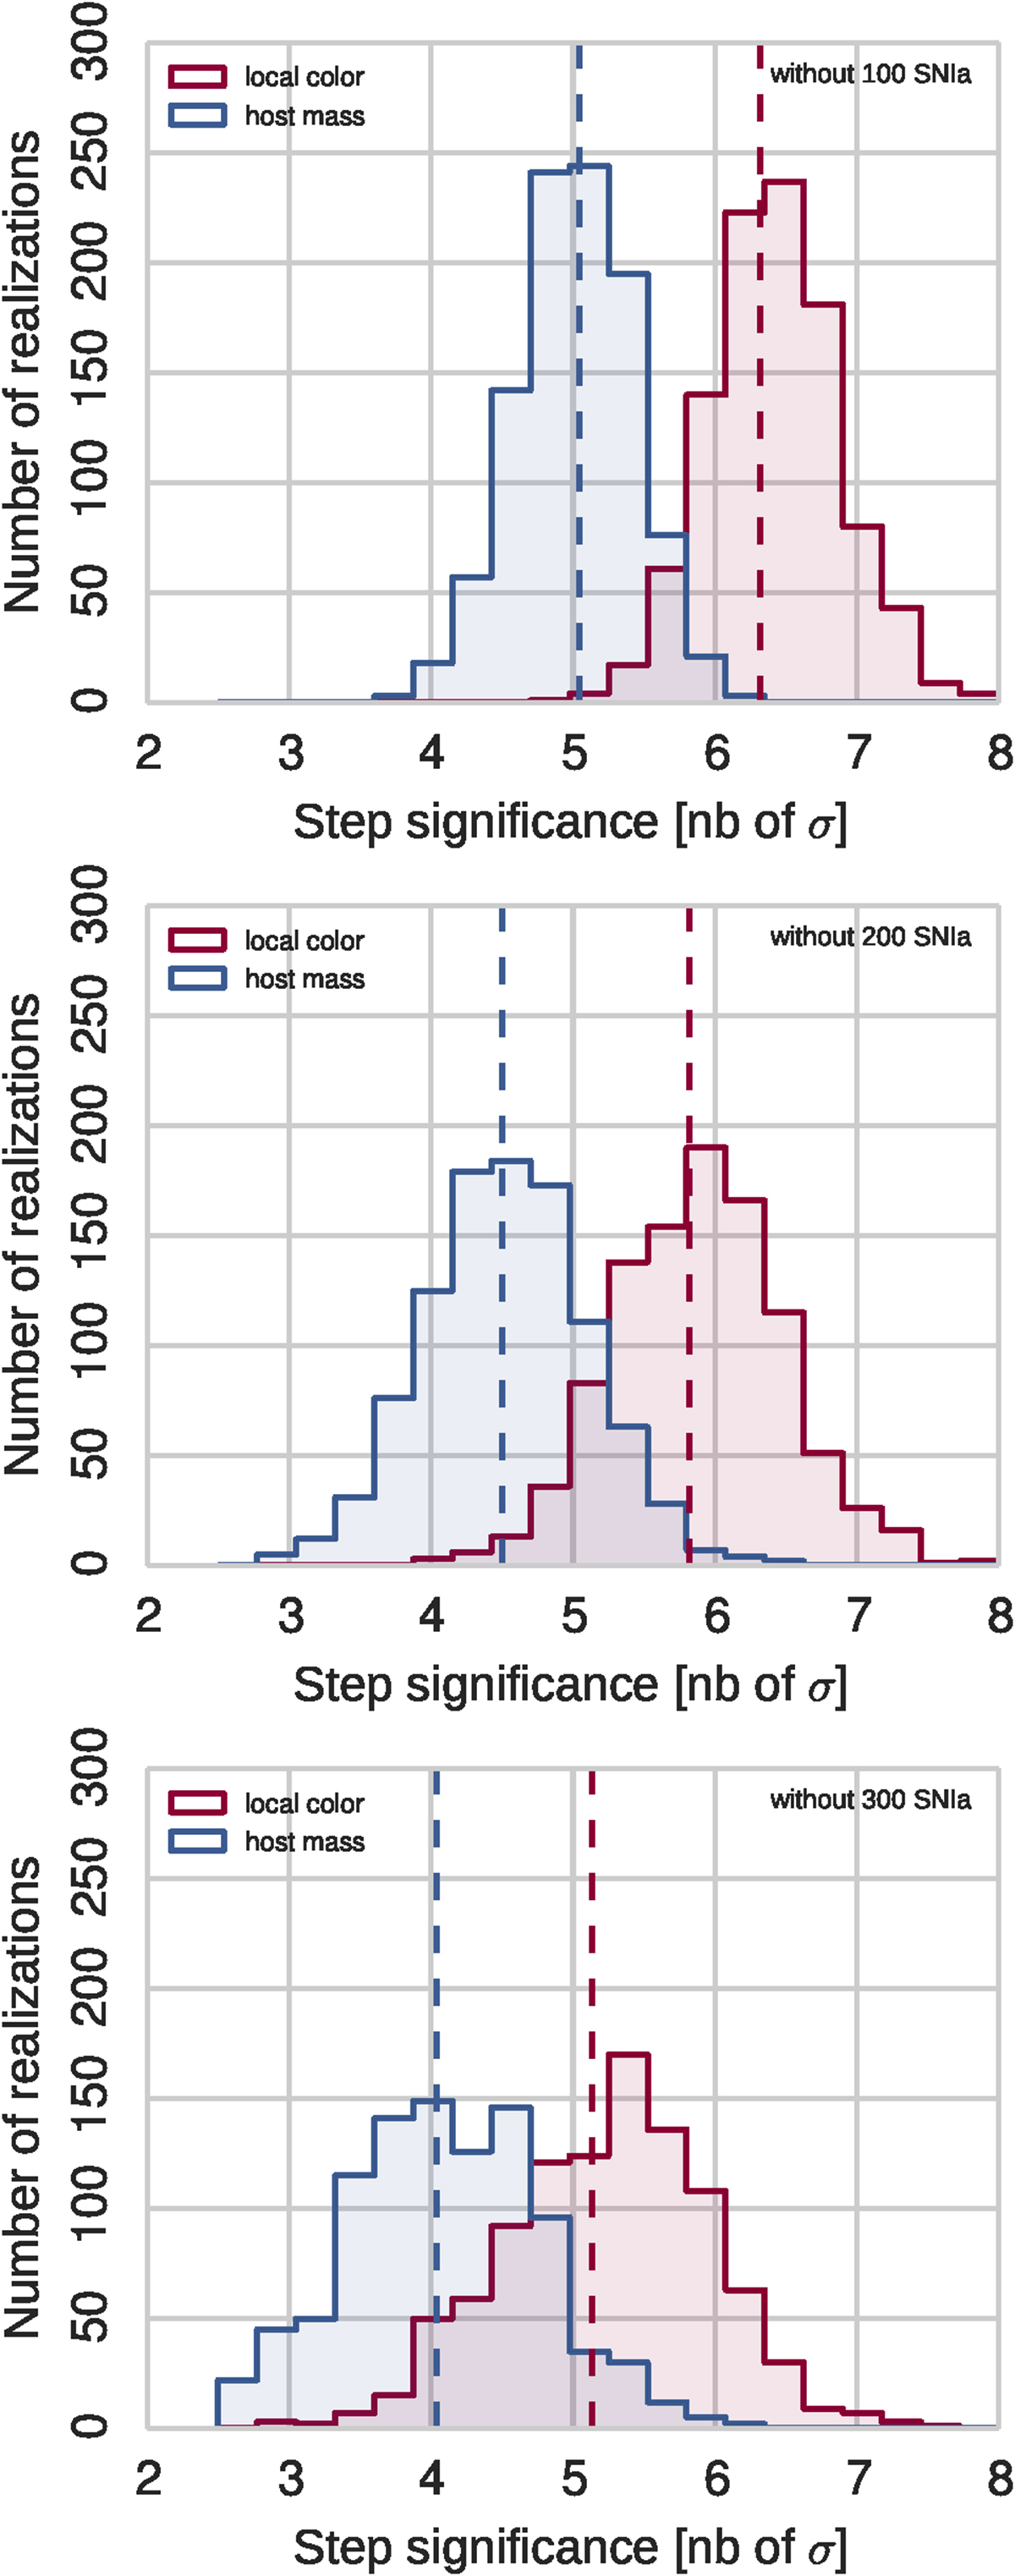
Histograms of the step significance of the local U − V color (dark red) and stellar mass of the host (dark blue) used as a third standardization parameterin the cosmological fit. Correlations are estimated by removing 100 (top panel), 200 (middle panel), and 300 (bottom panel) random supernovæ from the initial sample of events and repeating the process a thousand times. The expected significances, assuming that it scales with
![]() (
(![]() is the total number of supernovæ in the sample) are shown as the dashed lines with the same color code.
is the total number of supernovæ in the sample) are shown as the dashed lines with the same color code.
Current usage metrics show cumulative count of Article Views (full-text article views including HTML views, PDF and ePub downloads, according to the available data) and Abstracts Views on Vision4Press platform.
Data correspond to usage on the plateform after 2015. The current usage metrics is available 48-96 hours after online publication and is updated daily on week days.
Initial download of the metrics may take a while.