Free Access
Fig. 15
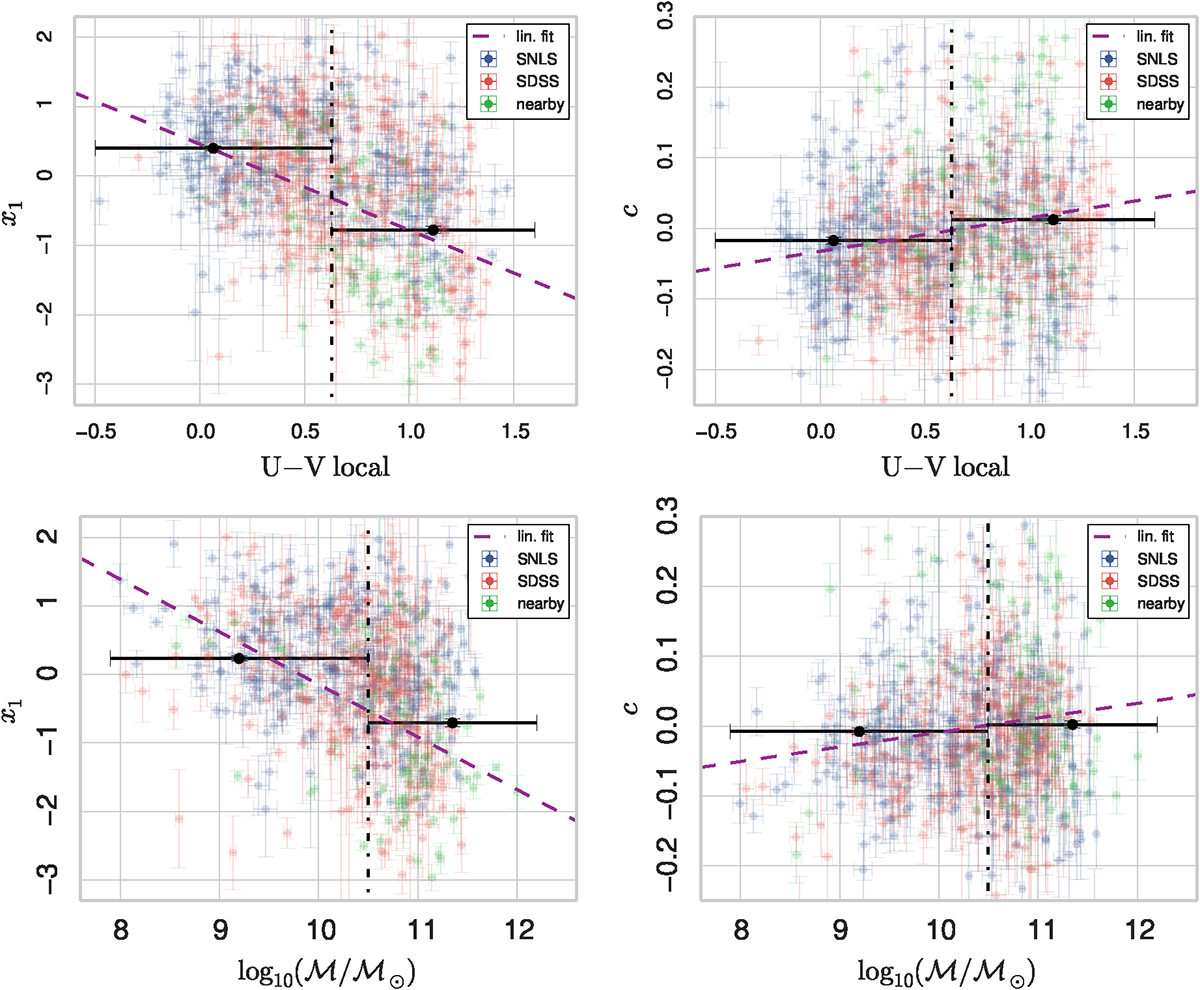
Correlations between supernova properties (stretch and color) as a function of local U − V color (first row) and host galaxy stellar mass (second row). The bins are drawn in black, with the weighted mean central values as black dots and the bin dispersion. Linear fits of the data are shown as dashed purple lines.
Current usage metrics show cumulative count of Article Views (full-text article views including HTML views, PDF and ePub downloads, according to the available data) and Abstracts Views on Vision4Press platform.
Data correspond to usage on the plateform after 2015. The current usage metrics is available 48-96 hours after online publication and is updated daily on week days.
Initial download of the metrics may take a while.