Fig. 13
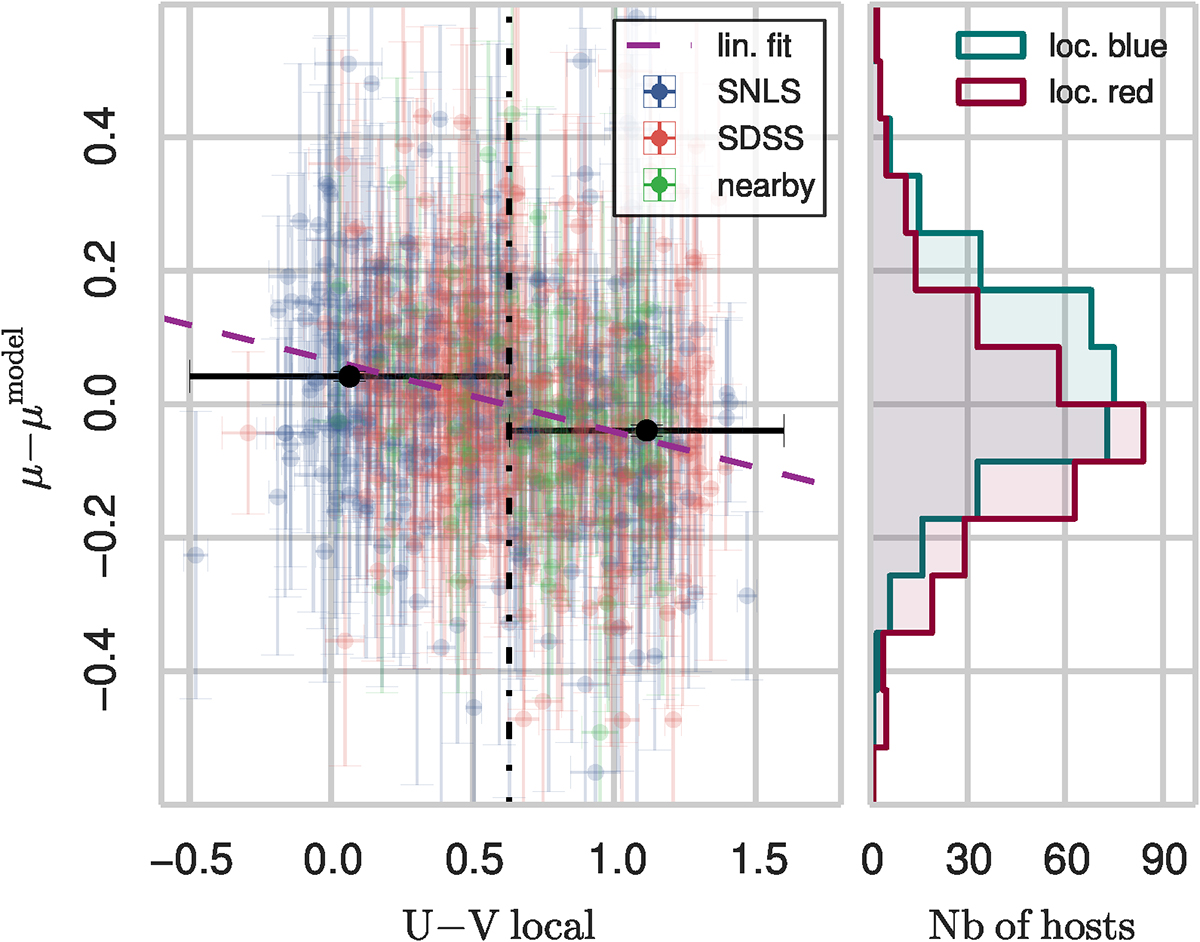
Correlation of local U − V rest-framecolors (in a region of 3 kpc around the supernova location) with Hubble diagram residuals corrected for stretch and color for the SNLS (blue dots), SDSS (red dots), and low-redshift (green dots) surveys. The separation between the two local color bins at U − V ~ 0.63, corresponding to the median value of the sample, is shown as the black vertical dash-dotted line. The bins are drawn in black, with the weighted mean values as black dots and their dispersion, divided by the square root of the number of elements in the bin. The purple dashed line shows the weighted linear fit for the entire color distribution. The top histogram displays the repartition of the 441 elements in terms of local color, together with the fit to a bimodal distribution represented by the solid red line. The histogram on the right draws the Hubble diagram residual distribution of blue SNIa regions (for local color values below the separation in U − V), associated with star-forming regions, together with the equivalent distribution of red regions (for local color values above the separation in U − V), associated with more passive areas.
Current usage metrics show cumulative count of Article Views (full-text article views including HTML views, PDF and ePub downloads, according to the available data) and Abstracts Views on Vision4Press platform.
Data correspond to usage on the plateform after 2015. The current usage metrics is available 48-96 hours after online publication and is updated daily on week days.
Initial download of the metrics may take a while.