Free Access
Fig. 12
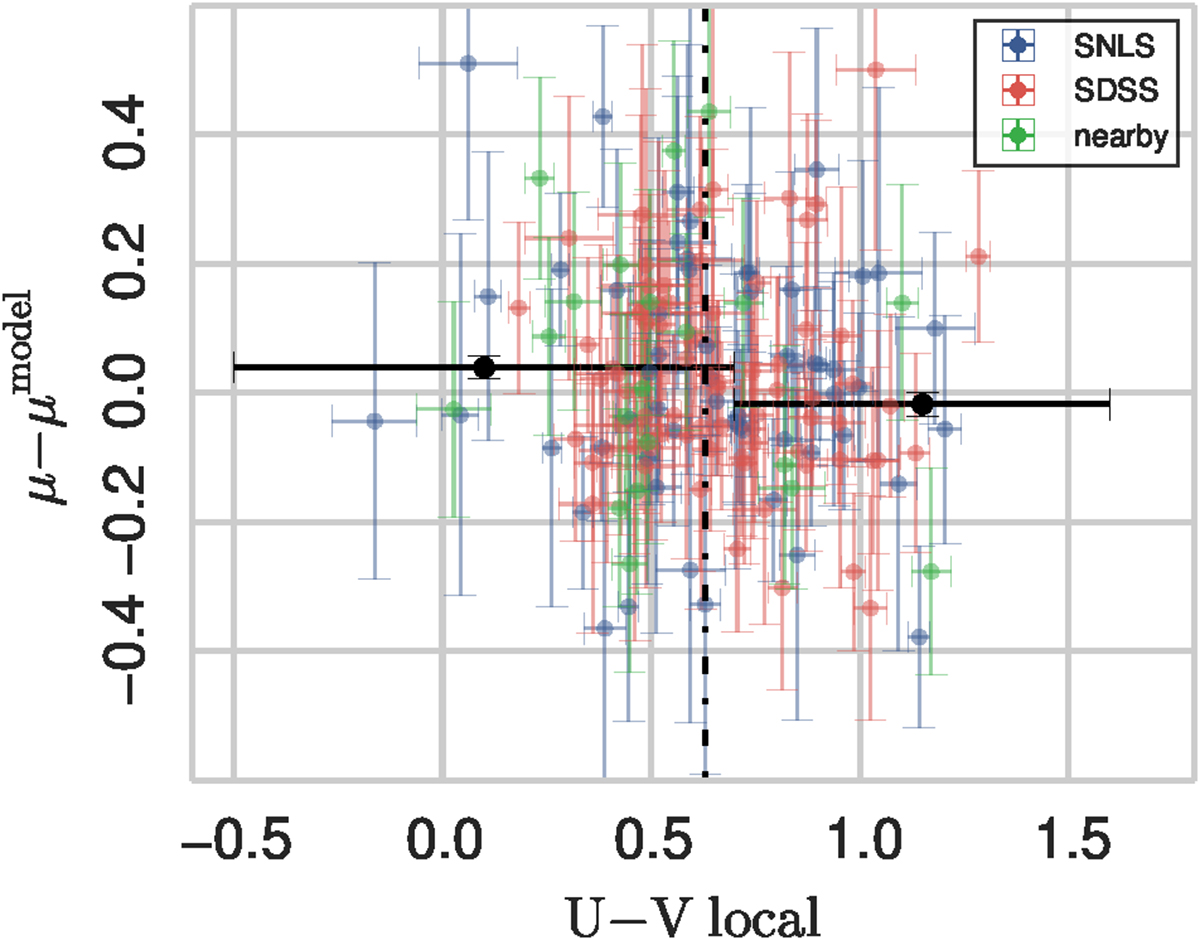
Correlation of local U − V rest-frame colors (in a region of 3 kpc around the supernova location) with Hubble diagram residuals corrected for stretch and color for the SNLS (blue dots), SDSS (red dots), and low-redshift (green dots) surveys for SNIa lying in the second and fourth quadrants of Fig. 10.
Current usage metrics show cumulative count of Article Views (full-text article views including HTML views, PDF and ePub downloads, according to the available data) and Abstracts Views on Vision4Press platform.
Data correspond to usage on the plateform after 2015. The current usage metrics is available 48-96 hours after online publication and is updated daily on week days.
Initial download of the metrics may take a while.