Fig. 10
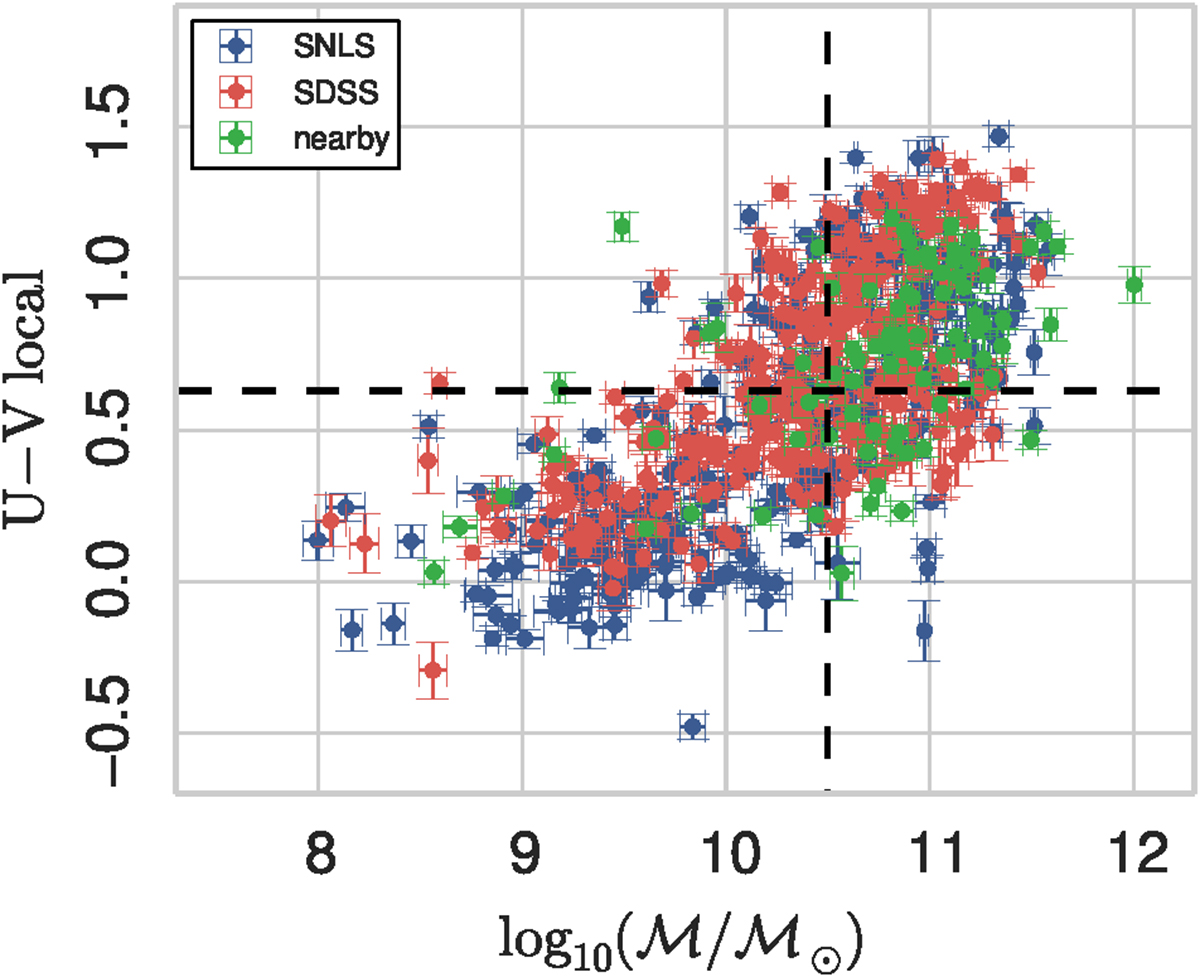
Local U − V rest-frame color of SNLS (blue dots), SDSS (red dots), and low-redshift survey (green dots) hosts in a region of 3 kpc around the supernova location as a function of the stellar mass of the host galaxy (in ![]() ). The gray horizontal and vertical dashed lines represent the bin separations we used to model the color and mass steps, which correspond to the distribution median.
). The gray horizontal and vertical dashed lines represent the bin separations we used to model the color and mass steps, which correspond to the distribution median.
Current usage metrics show cumulative count of Article Views (full-text article views including HTML views, PDF and ePub downloads, according to the available data) and Abstracts Views on Vision4Press platform.
Data correspond to usage on the plateform after 2015. The current usage metrics is available 48-96 hours after online publication and is updated daily on week days.
Initial download of the metrics may take a while.