Fig. 7.
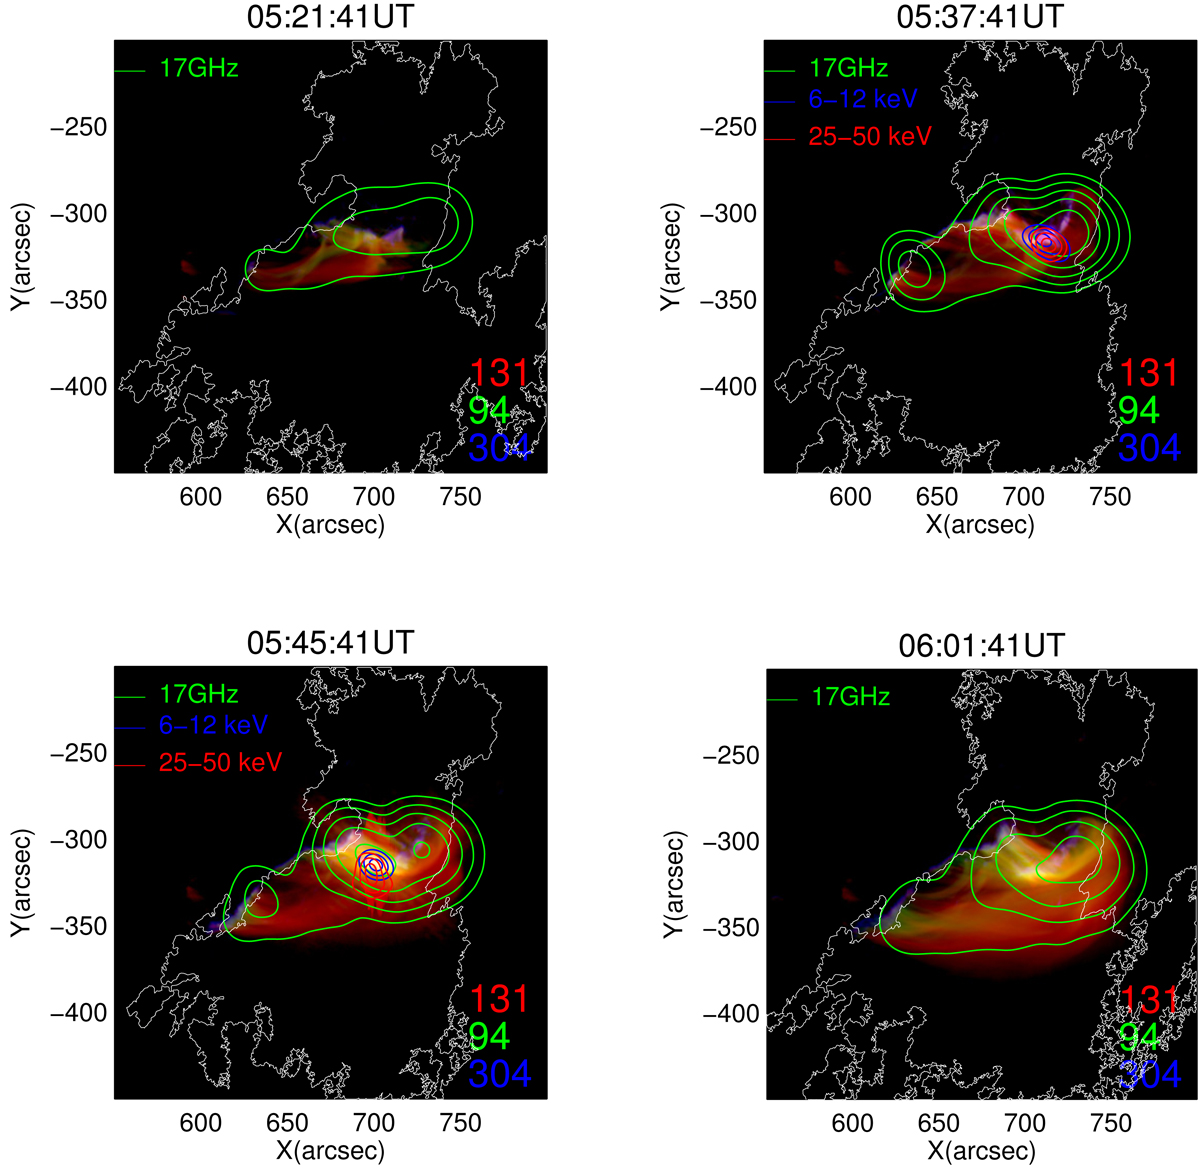
SDO/AIA multiwavelength images for the four periods shown in Fig. 3. Contours of the corresponding 17 GHz images are overplotted. To facilitate comparison between EUV and radio images, the AIA images are also averaged over a 2-min period. At the peak of the gradual emission, some of the AIA images saturate. The white line marks the neutral line of the line-of-sight magnetic field. Contours of RHESSI images at 6–12 keV and 25–50 keV are also shown for the flux peaks of the impulsive and the gradual emission. The contour levels are 90%, 70%, and 50% of the corresponding peak brightness. The front segment of detectors 4, 5, 6, 7, and 8 are used to construct the RHESSI image with the CLEAN algorithm with an integration time of 20 s.
Current usage metrics show cumulative count of Article Views (full-text article views including HTML views, PDF and ePub downloads, according to the available data) and Abstracts Views on Vision4Press platform.
Data correspond to usage on the plateform after 2015. The current usage metrics is available 48-96 hours after online publication and is updated daily on week days.
Initial download of the metrics may take a while.