Fig. 4.
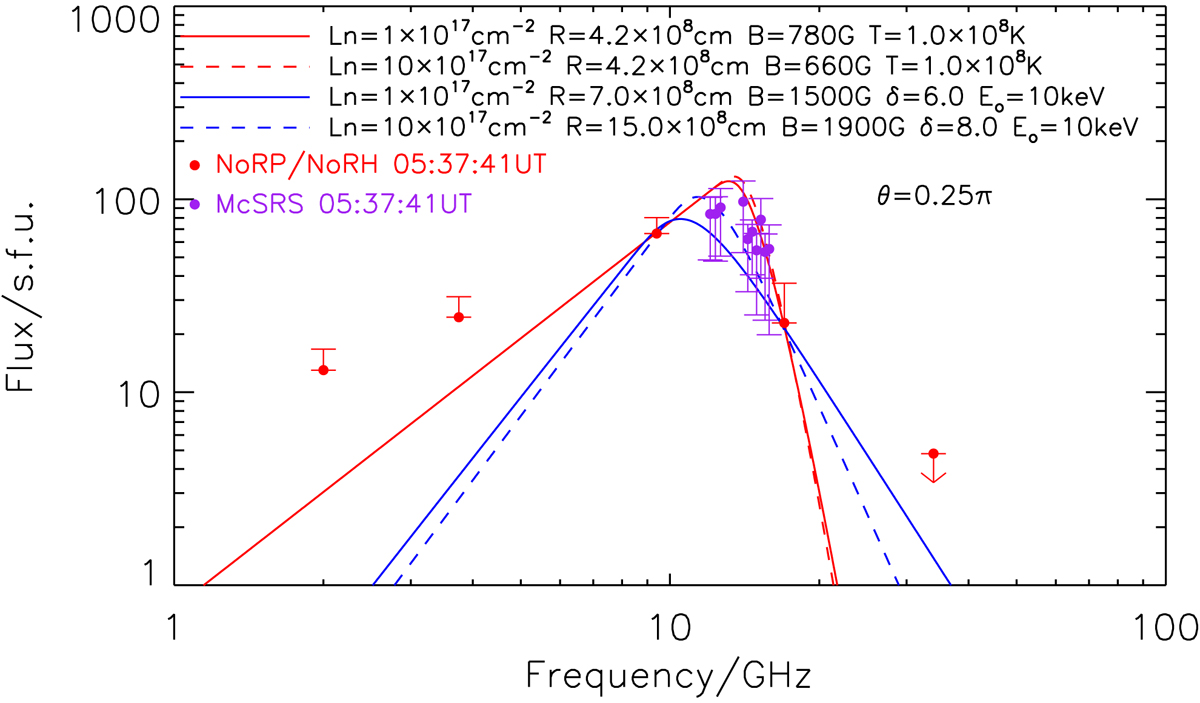
Radio spectrum of the flare at the peak of impulsive emission 05:37:41 UT. The upper and lower bounds of the 2, 3.75, 9.4, and 17 GHz flux densities are for the whole flare (dot-dashed) and the impulsive (solid) component in Fig. 2, respectively. The upper bound of the 34 GHz data corresponds to the flux density from the bright region with the brightness temperature higher than 4 × 10⁵ K at the peak of impulsive 17 GHz emission (red dot-dashed line in Fig. 2). The purple data show observations with the Mengcheng Solar Radio Spectrometer (McSRS). The lines show model fits to the spectrum. See text for details.
Current usage metrics show cumulative count of Article Views (full-text article views including HTML views, PDF and ePub downloads, according to the available data) and Abstracts Views on Vision4Press platform.
Data correspond to usage on the plateform after 2015. The current usage metrics is available 48-96 hours after online publication and is updated daily on week days.
Initial download of the metrics may take a while.