Fig. 3.
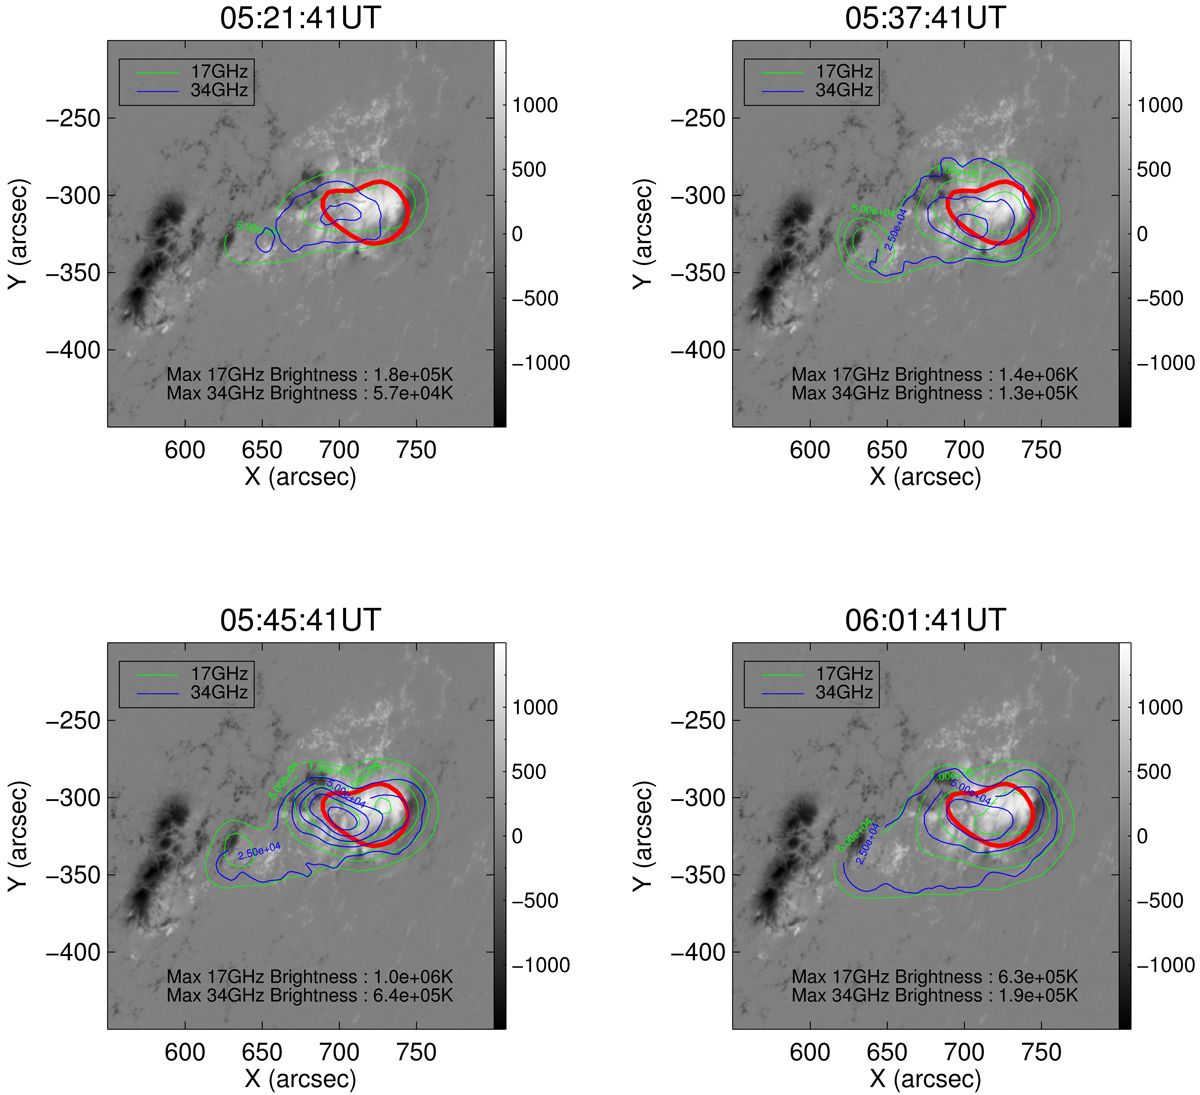
NoRH images of the flare in the pre-heating phase (5:21:41 UT), at the peak of the impulsive (5:37:41 UT) and gradual (5:45:41 UT) emission, and in the gradual decay phase (6:01:41 UT). The background is the SDO/HMI images of the line-of-sight magnetic field ranging between about −1500 gauss and 1500 gauss. The red contour, the same as that in the inset in Fig. 2, marks the boundary of an emission region with the 17 GHz brightness temperature greater than 4 × 10⁵ K at the peak of the impulsive phase. The contours at 17 GHz and 34 GHz start at 5 × 10⁴ K and 2.5 × 10⁴ K, respectively. The contours are separated from each other by a factor of 2. The maximum brightnesses are indicated in the figures.
Current usage metrics show cumulative count of Article Views (full-text article views including HTML views, PDF and ePub downloads, according to the available data) and Abstracts Views on Vision4Press platform.
Data correspond to usage on the plateform after 2015. The current usage metrics is available 48-96 hours after online publication and is updated daily on week days.
Initial download of the metrics may take a while.