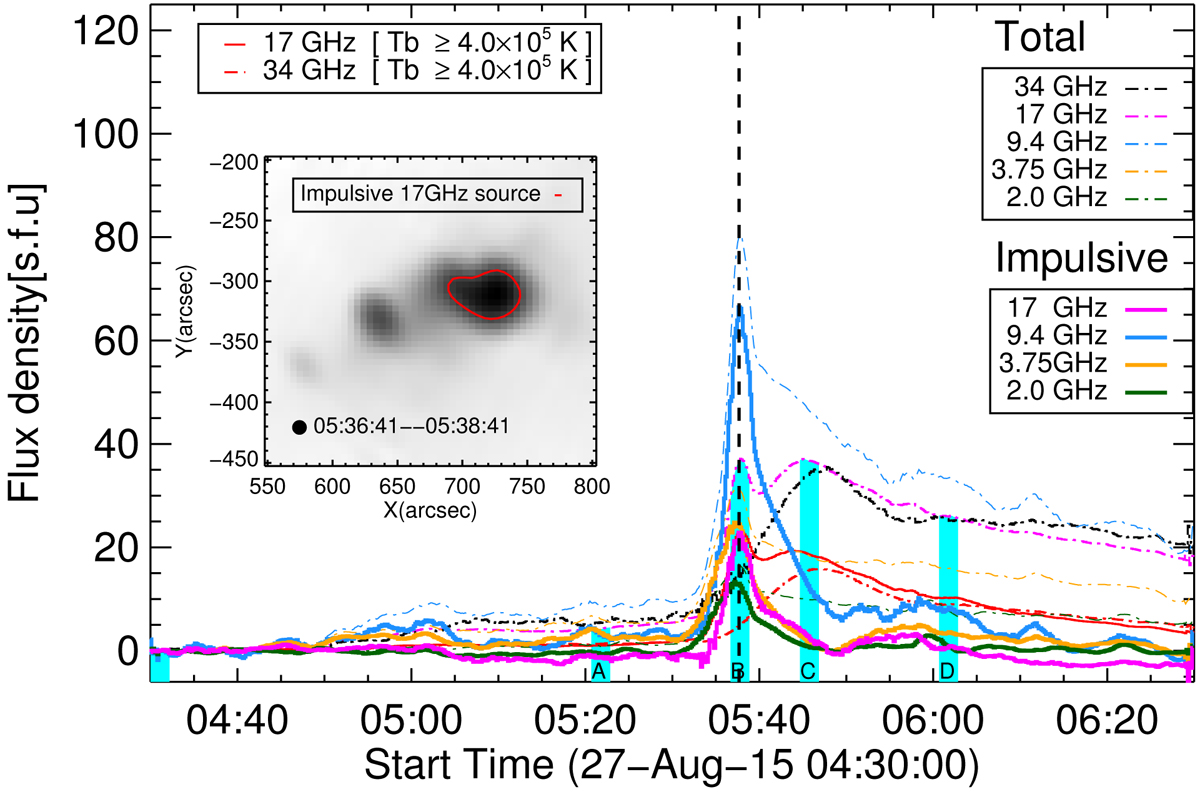
Fig. 2.

Light curves of different emission components from NoRP 2 GHz, 3.75 GHz, 9.4 GHz, and NoRH 17 GHz, 34 GHz. The dot-dashed lines are for the 2-min averaged total emission and the solid lines are for the impulsive component. The thick pink and solid blue lines are obtained by subtracting the 34 GHz flux density from the 17 GHz and 9.4 GHz flux densities, respectively. The red lines indicate emissions from a region with a brightness temperature higher than 4 × 10⁵ K at the flux peak of the impulsive 17 GHz emission. The corresponding image (see inset) is shown with the red contour indicating the brightness temperature of 4 × 10⁵ K. The cyan vertical bars mark the periods for the pre-flare background subtraction and for the four images shown in Fig. 3.
Current usage metrics show cumulative count of Article Views (full-text article views including HTML views, PDF and ePub downloads, according to the available data) and Abstracts Views on Vision4Press platform.
Data correspond to usage on the plateform after 2015. The current usage metrics is available 48-96 hours after online publication and is updated daily on week days.
Initial download of the metrics may take a while.


