Fig. 1.
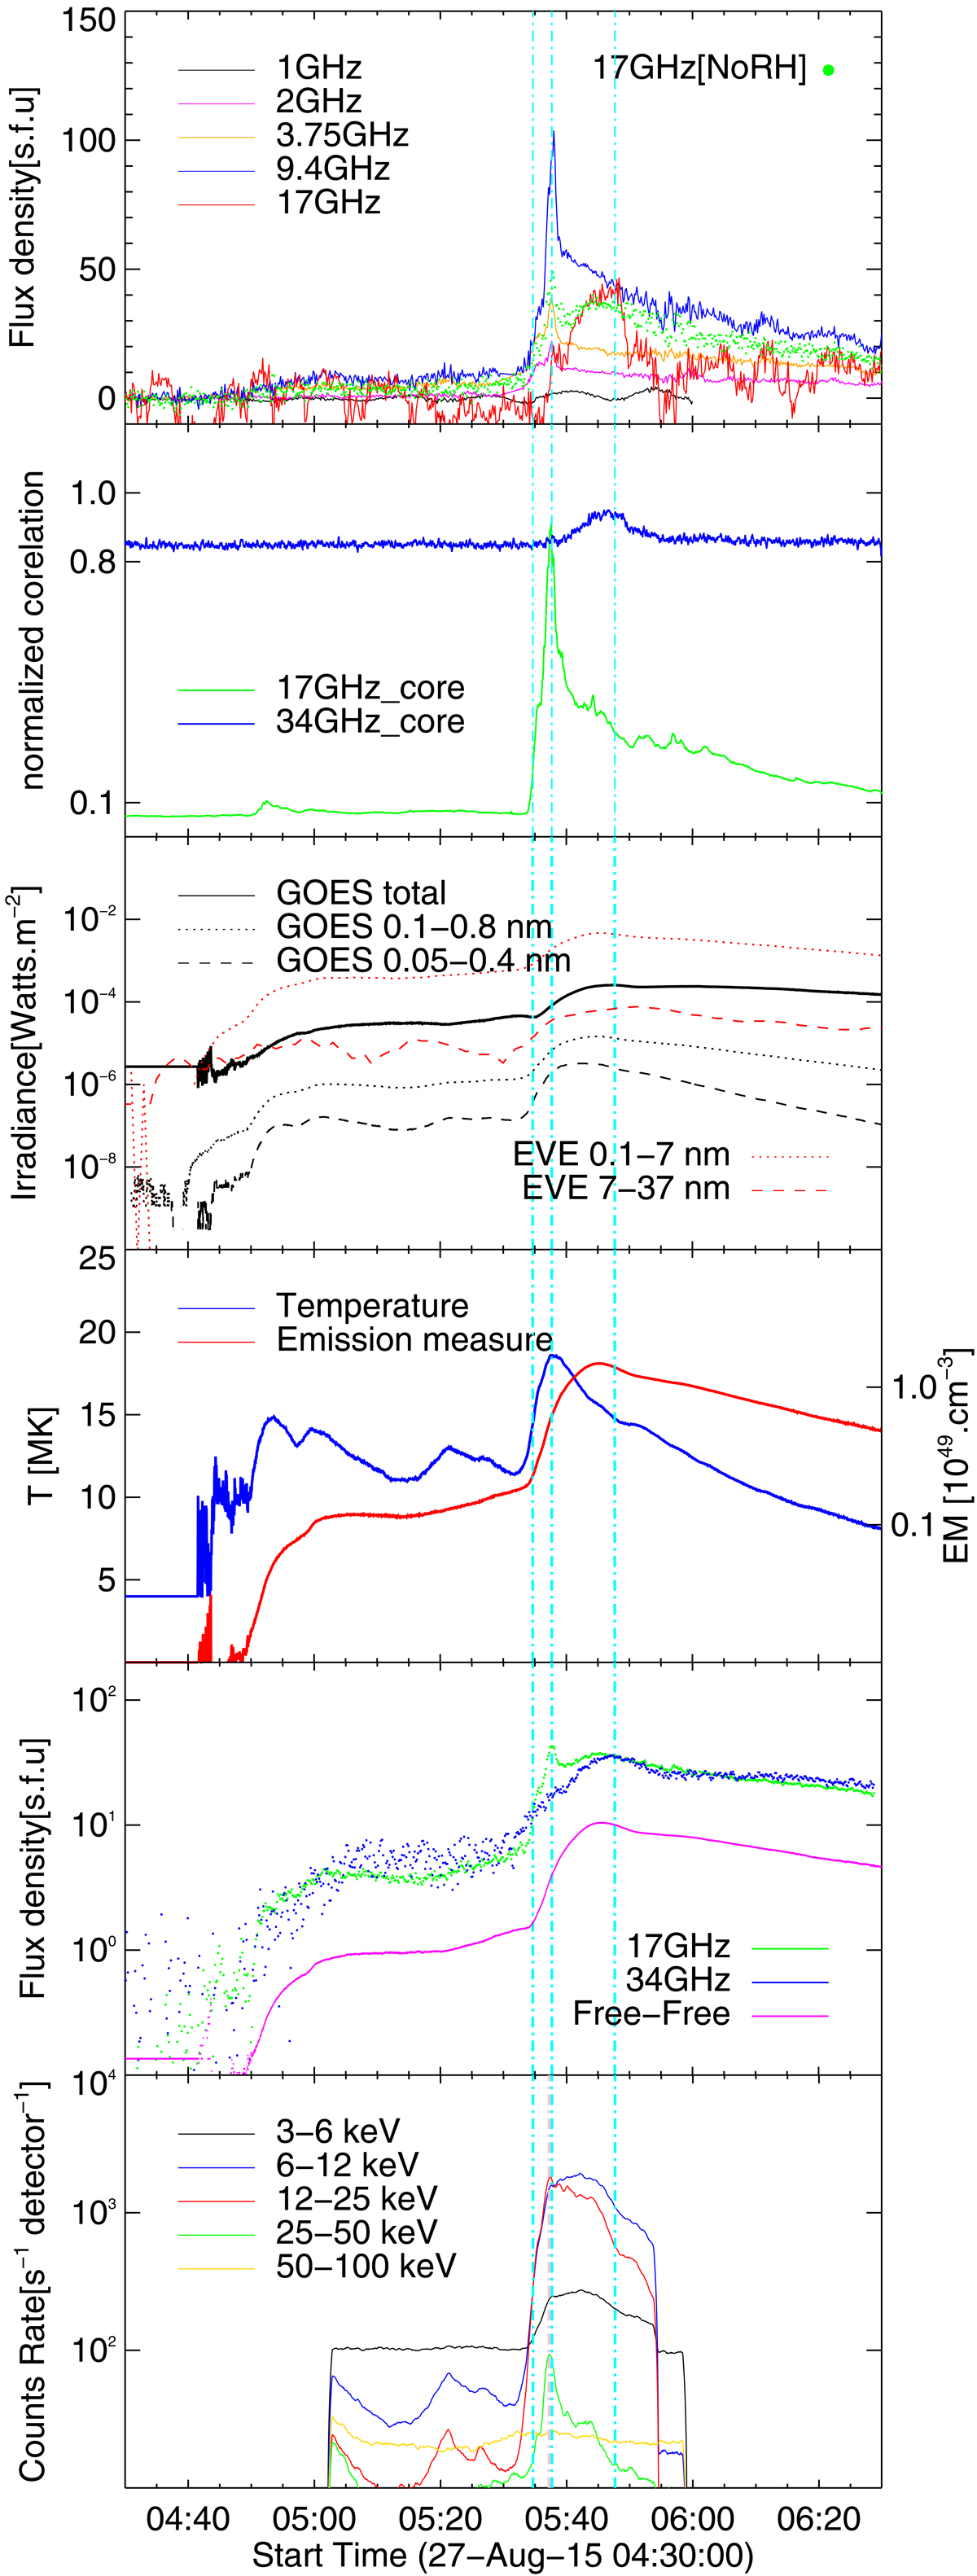
Evolution of fluxes and model parameters for an M2.9 flare observed on August 27, 2005. From top to bottom: (1) radio light curves obtained with the NoRP and 17 GHz light curve obtained with the NoRH; (2) normalized correlation coefficients of the NoRH observations at 17 and 34 GHz; (3) SDO/EVE light curves and GOES light curves, the solid line gives the bolometric flux of the isothermal plasma inferred from GOES flux measurements; (4) temperature and emission measure derived from GOES fluxes; (5) radio light curves at 17 GHz and 34 GHz obtained with the NoRH, the pink solid line gives the optically thin 17 GHz radio flux density produced via the bremsstrahlung process by the isothermal plasma inferred from GOES observations; and (6) hard X-ray light curves obtained with the RHESSI. The vertical dot-dashed lines are drawn to facilitate the comparison between the panels.
Current usage metrics show cumulative count of Article Views (full-text article views including HTML views, PDF and ePub downloads, according to the available data) and Abstracts Views on Vision4Press platform.
Data correspond to usage on the plateform after 2015. The current usage metrics is available 48-96 hours after online publication and is updated daily on week days.
Initial download of the metrics may take a while.