Fig. 14
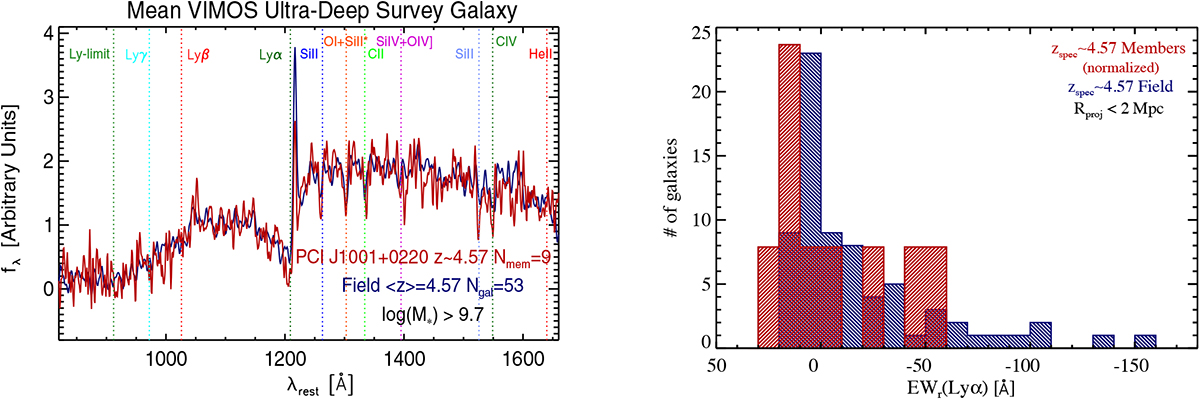
Left panel: unit-weighted (normalized) mean rest-frame VUDS spectra of the nine spec-z members ofthe PCl J1001+0220 proto-cluster plotted against that of the 53 coeval field galaxies (one galaxy was removed due to the presence of severe reduction artifacts). The requisite stellar mass limit for each coaddition is given in the figure panel. Each spectrum is smoothed with a Gaussian of FWHM = 1.5 pixels (1.45 Å). Important absorption and emission features frequently observed in VUDS spectra are marked by vertical lines. Clear differences can be observed between the two spectra, with the proto-cluster members exhibiting, on average, reduced Lyα emission andexaggerated absorption in Hydrogen and various metal lines relative to the average coeval field galaxy. In both cases, a significant (~300 km s−1) offset to the red can be seen for the Lyα line potentially indicating that large-scale outflows are pervasive in galaxies at this redshift. Right panel: distribution of rest-frame Lyα equivalent widths (EWs) for the proto-cluster (red histogram) and coeval field sample (blue histogram) measured on individual spectra. Negative or positive EW indicates the line is seen in emission or absorption, respectively. The two distributions are inconsistent at >3σ, the Lyα feature being more likely to be seen in absorption for the proto-cluster members.
Current usage metrics show cumulative count of Article Views (full-text article views including HTML views, PDF and ePub downloads, according to the available data) and Abstracts Views on Vision4Press platform.
Data correspond to usage on the plateform after 2015. The current usage metrics is available 48-96 hours after online publication and is updated daily on week days.
Initial download of the metrics may take a while.