Free Access
Fig. 7.
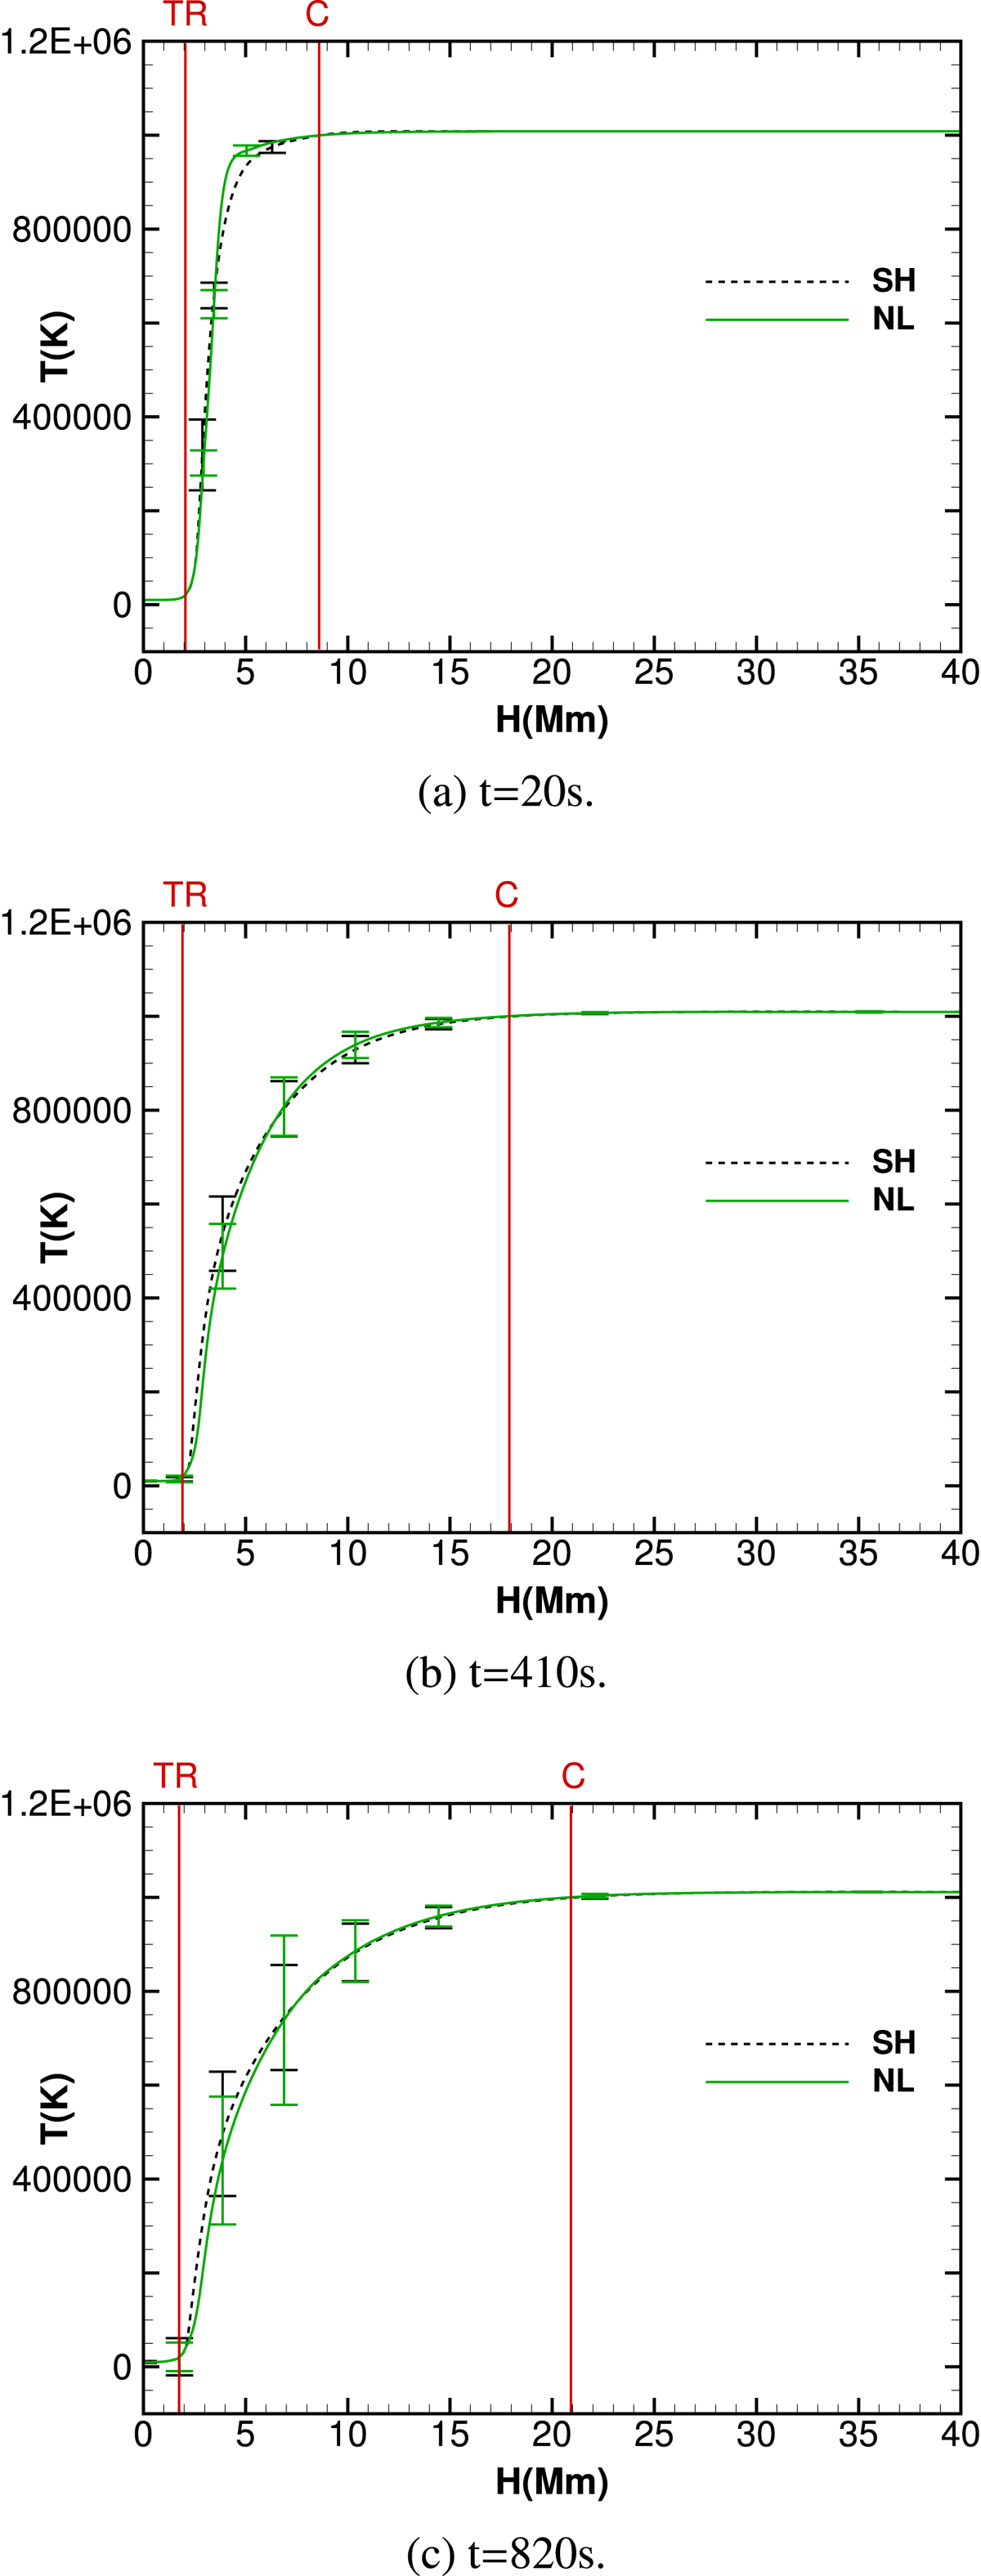
Average temperature T(K) over the xy-plane as a function of height (H) obtained using the SH and NL heat flux models for three different instants of time: (a) t = 20 s, (b) t = 410 s, and (c) t = 820 s. Standard deviations for the SH (NL) heat flux model are shown using black (green) vertical bars.
Current usage metrics show cumulative count of Article Views (full-text article views including HTML views, PDF and ePub downloads, according to the available data) and Abstracts Views on Vision4Press platform.
Data correspond to usage on the plateform after 2015. The current usage metrics is available 48-96 hours after online publication and is updated daily on week days.
Initial download of the metrics may take a while.