Free Access
Fig. 5.
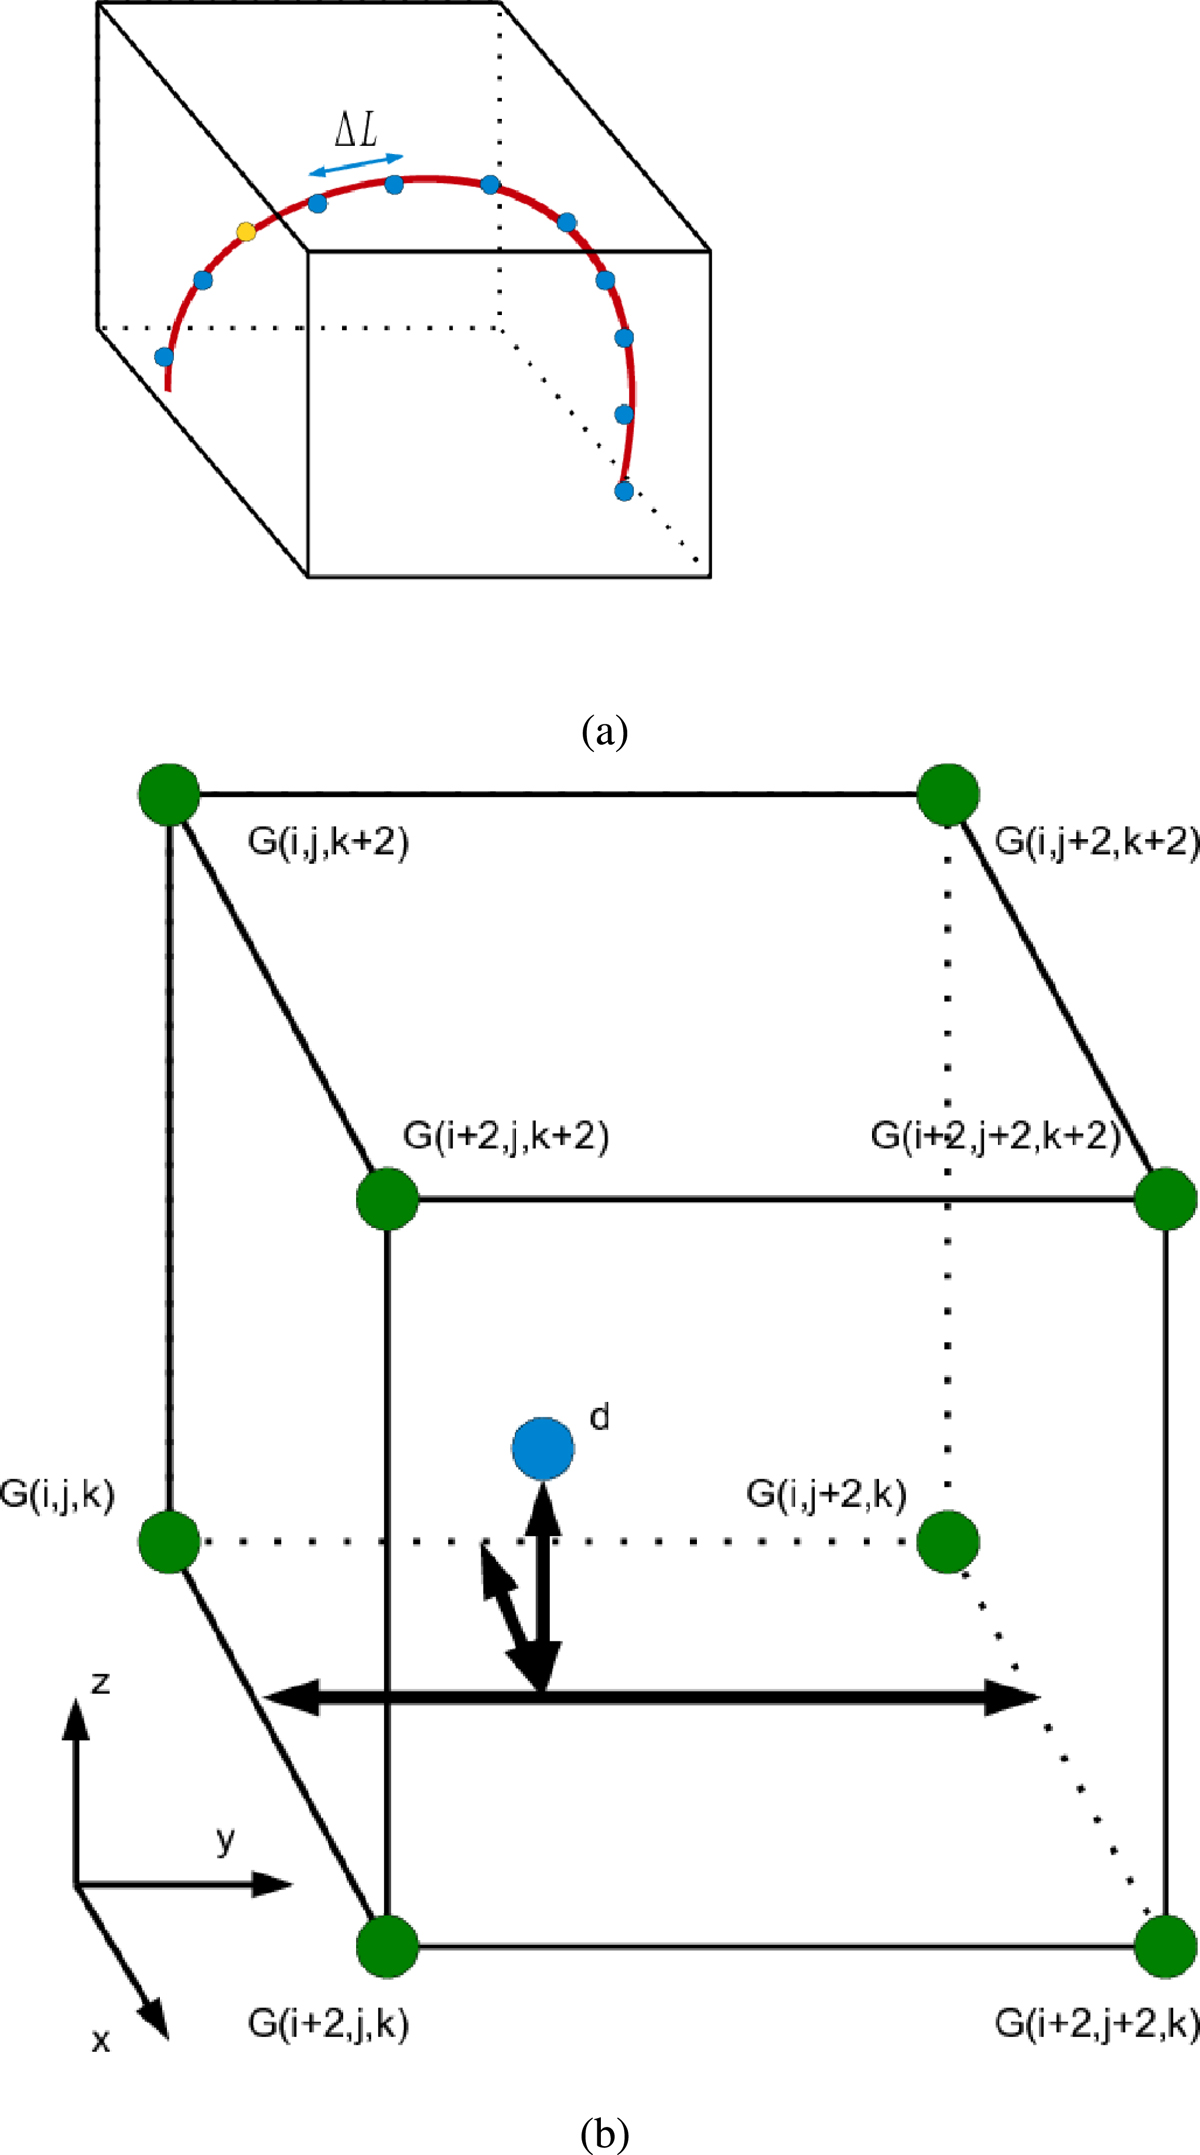
Panel a: Tracing of the magnetic field for the whole domain starting at the yellow grid point and moving through the blue points. Panel b: Mesh points, G, in green used to interpolate the variables at the blue point at a distance d from the origin of the Cartesian grid.
Current usage metrics show cumulative count of Article Views (full-text article views including HTML views, PDF and ePub downloads, according to the available data) and Abstracts Views on Vision4Press platform.
Data correspond to usage on the plateform after 2015. The current usage metrics is available 48-96 hours after online publication and is updated daily on week days.
Initial download of the metrics may take a while.