Fig. 8
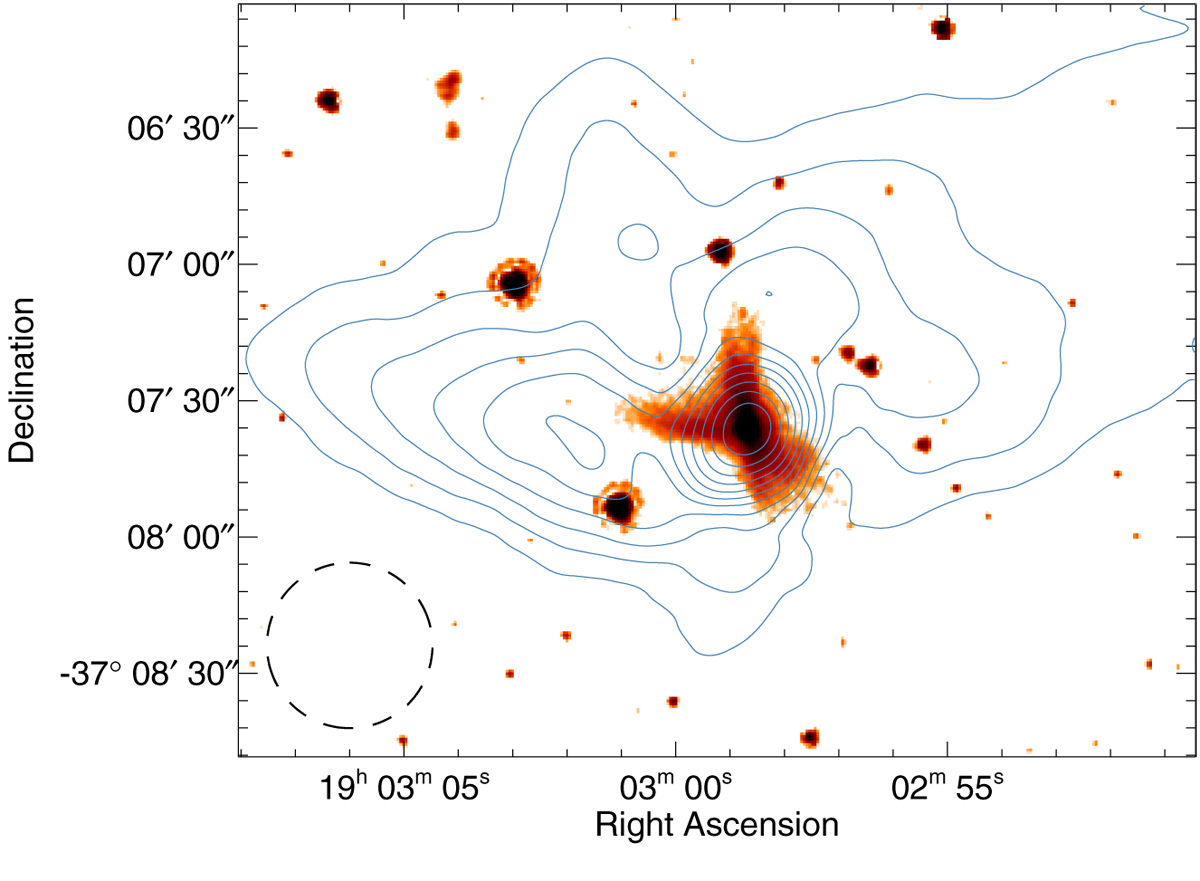
IRAS 32c (IRAS 18595-3712; Wilking et al. 1992) with Herschel column density contours plotted in blue. The lowest contour is 7 × 10²² N(H2) cm−2 and each sequential contour is 1.2 times higher than the previous one. The colour image is Spitzer 4.5-μm data showing a larger area coverage version of the same region of sky discussed and presented by Peterson et al. (2011, Fig. 15 and Appendix A.44). The Herschel column density contours form a “bay” of material to the north-east of the source. This appears to be showing the cavity that is swept out by a jet not visible within this figure. The dashed circle in the bottom left corner represents the ~ 18″ Herschel resolution of the column density map.
Current usage metrics show cumulative count of Article Views (full-text article views including HTML views, PDF and ePub downloads, according to the available data) and Abstracts Views on Vision4Press platform.
Data correspond to usage on the plateform after 2015. The current usage metrics is available 48-96 hours after online publication and is updated daily on week days.
Initial download of the metrics may take a while.