Fig. 7
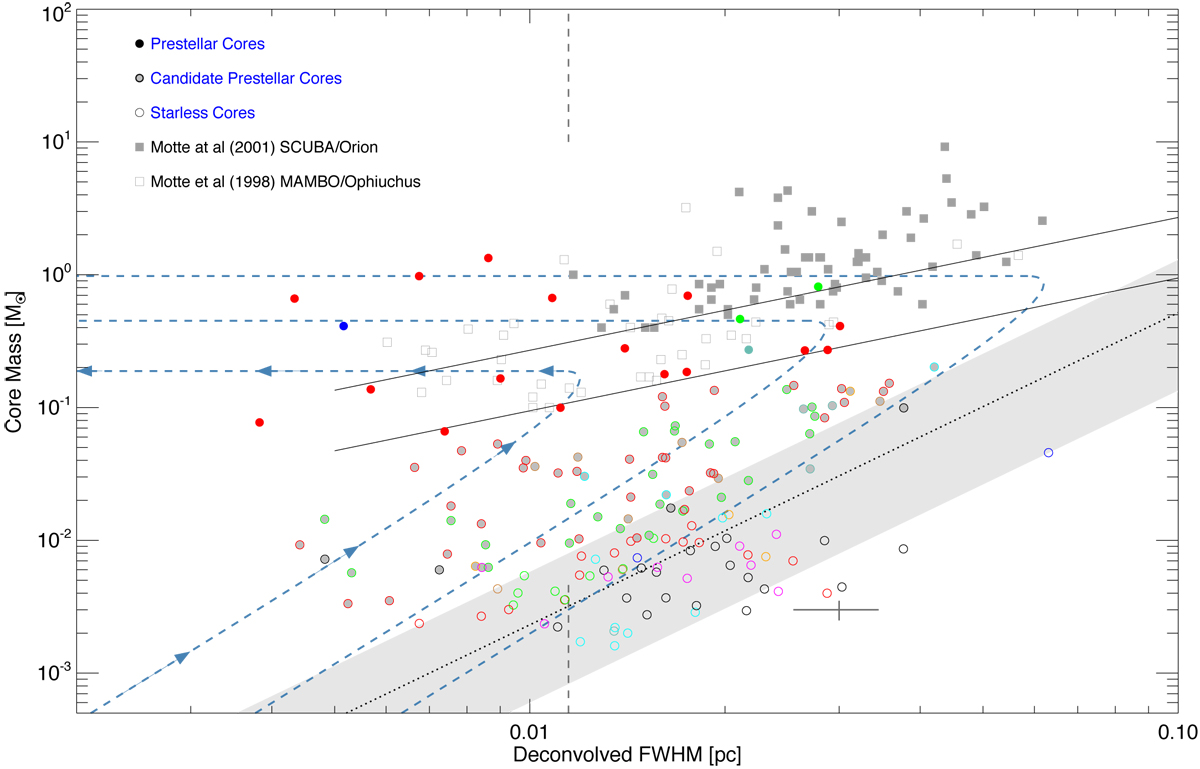
Mass-size diagram for the population of 163 starless cores extracted by getsources from the Herschel data. The open circles represent cores that were classified as unbound starless cores. The robust prestellar cores are indicated by circles filledusing the same colour as their respective subregion. Candidate prestellar cores are filled in grey, with an outer circle colour-coded to their respective subregion (see Fig. 5), or black for cores with no assigned subregion. Shaded grey squares indicate the cores found in Orion using SCUBA (Motte et al. 2001), and the open squares indicate cores found in Ophiuchus using MAMBO (Motte et al. 1998). The shaded grey band indicates the mass-size correlation observed for unbound CO clumps (Elmegreen & Falgarone 1996). There are two model lines representing critical isothermal Bonnor–Ebert spheres, shown in black. The upper and lower lines represent BE spheres at T = 20 K and T = 7 K, respectively. The dashed blue curves show the evolutionary tracks of starless cores, modelled as quasi-statically accreting isothermal Bonnor–Ebert spheres, for three ambient external pressures; 2.5, 5, and 20 × 106 K cm−3, as hypothesised by Simpson et al. (2011). The leftmost evolutionary line shows the direction of evolution. The two vertical dark grey lines indicate the physical 18.2″ resolution in the plane of sky at the assumed 130 pc distance of CrA. The dark grey cross is the typical error in the mass and FWHM radius.
Current usage metrics show cumulative count of Article Views (full-text article views including HTML views, PDF and ePub downloads, according to the available data) and Abstracts Views on Vision4Press platform.
Data correspond to usage on the plateform after 2015. The current usage metrics is available 48-96 hours after online publication and is updated daily on week days.
Initial download of the metrics may take a while.