Fig. 5
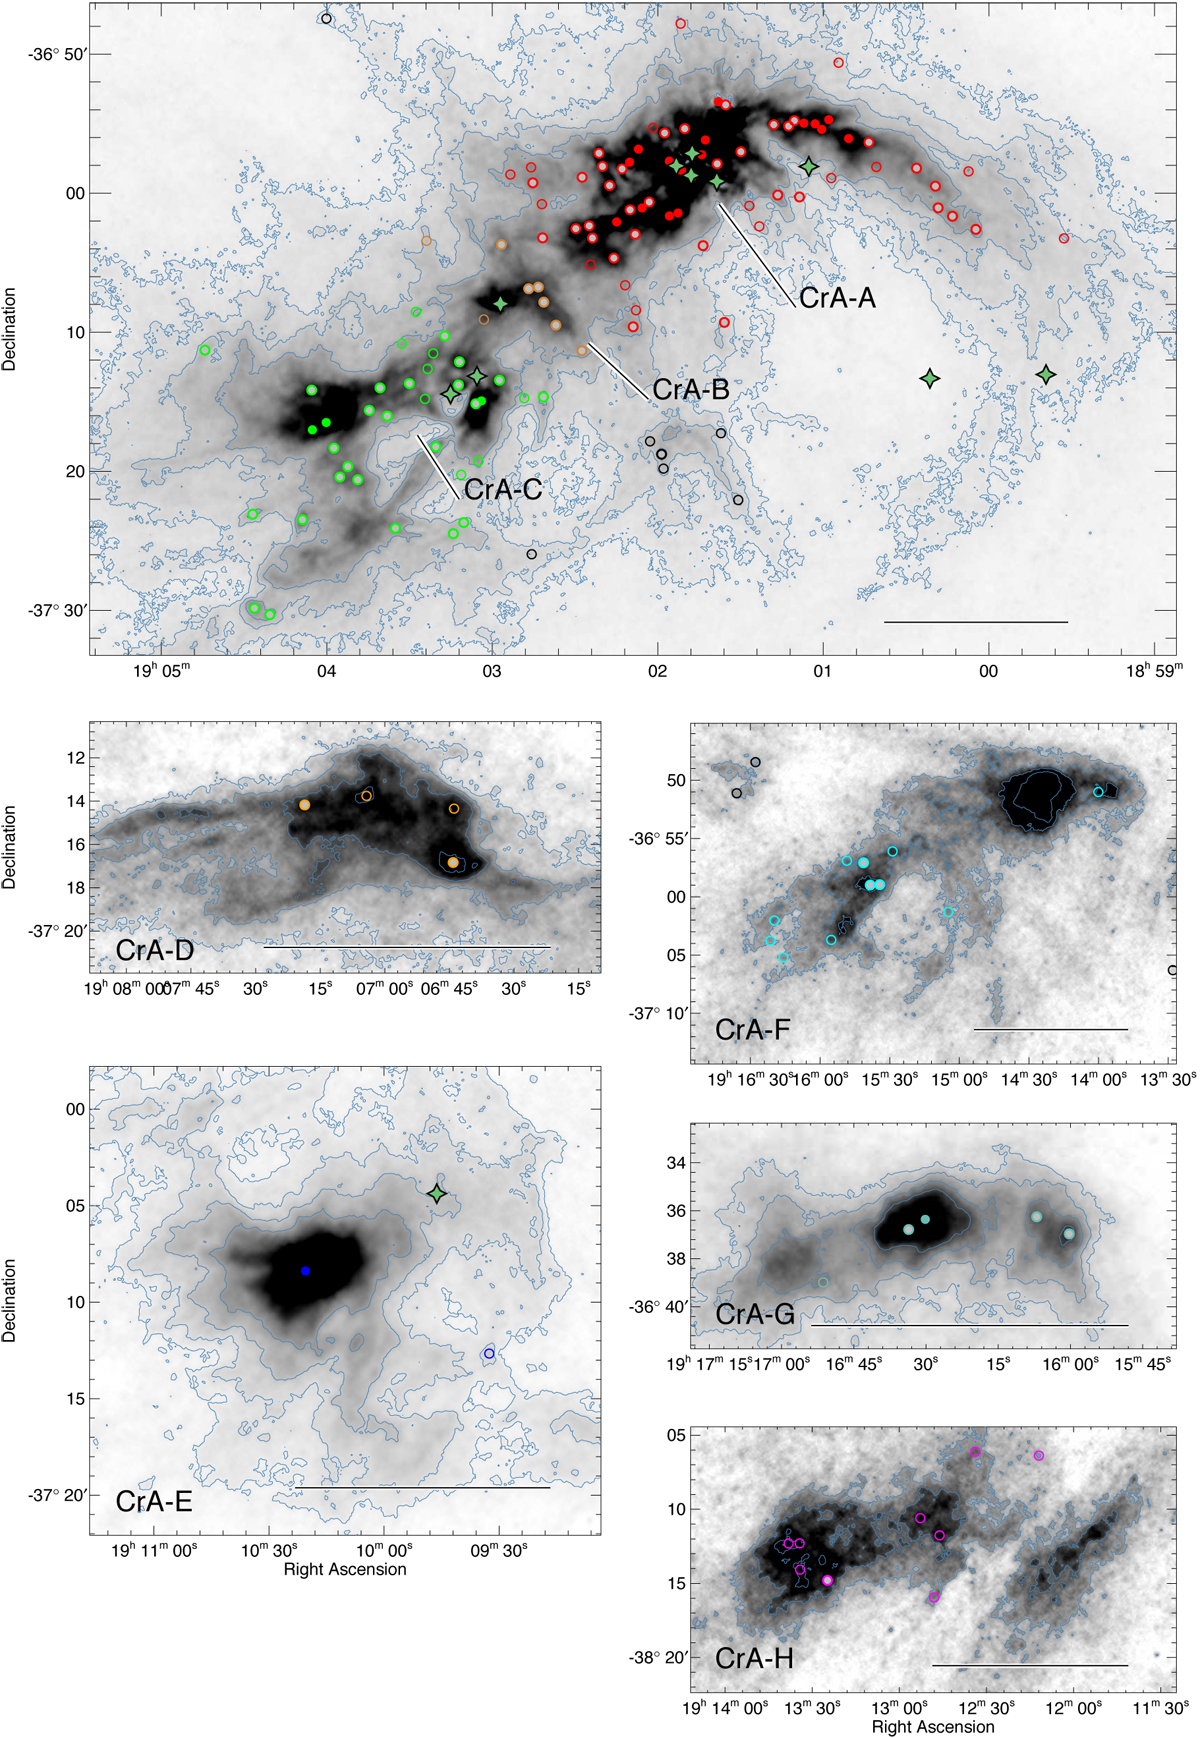
Division of the Corona Australis molecular cloud into significant “clumps” of emission that are prominent in all emission maps and the column density maps. The hollow, grey-filled, and colour-filled circles are starless cores, candidate prestellar cores, and robust prestellar cores, respectively. The following colours are used for the symbols: red for CrA-A, brown for CrA-B, green for CrA-C, orange for CrA-D, dark blue for CrA-E, cyan for CrA-F, sea green for CrA-G, and magenta for CrA-H. The green stars represent YSO and protostellar candidates. Cores with no defined subregion are black. The contour levels start from 3σ ~ 1021 N(H2) cm−2, and increase in levels of 1.5 times the previous level. The black bars towards the lower right of each cut-out show a 0.5 pc transverse distance at the adopted distance of CrA.
Current usage metrics show cumulative count of Article Views (full-text article views including HTML views, PDF and ePub downloads, according to the available data) and Abstracts Views on Vision4Press platform.
Data correspond to usage on the plateform after 2015. The current usage metrics is available 48-96 hours after online publication and is updated daily on week days.
Initial download of the metrics may take a while.