Fig. C.1
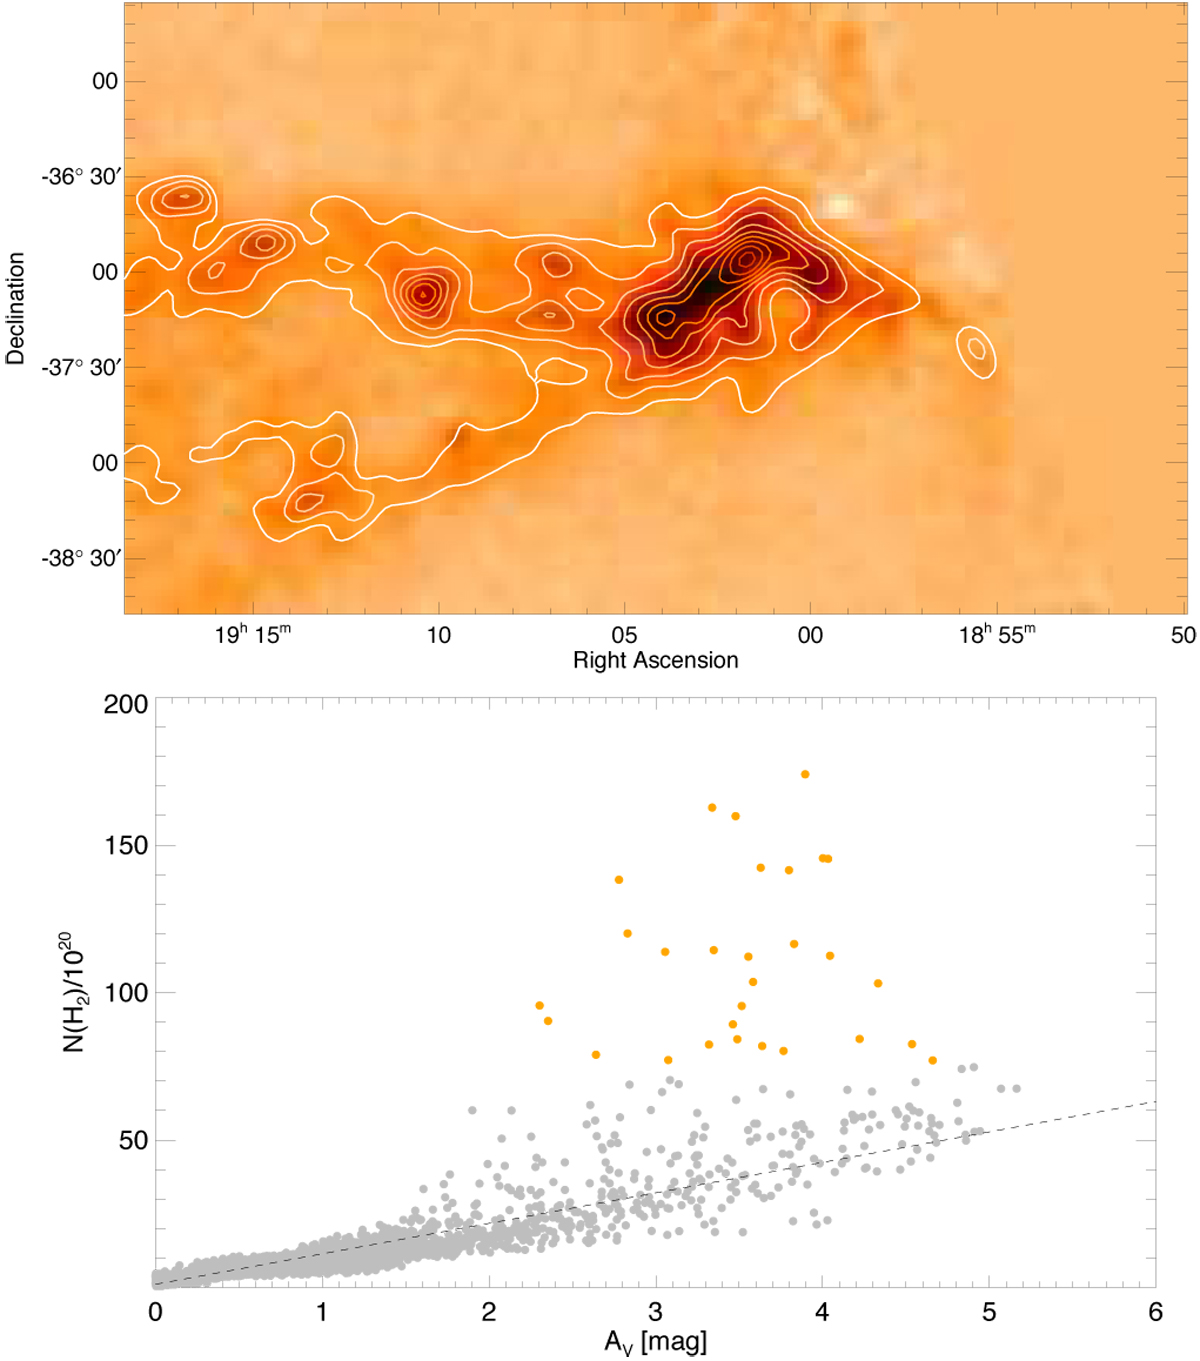
Toppanel: AV extinction map derived by Dobashi et al. (2005), with the Herschel low column density map contours overlaid in white. The contours start from 3σ, with each consecutive contour being 1.5 times the previous level. Lower panel: AV against the column density along the line of sight. The grey dashed line is the fit N(H2)∕AV = 1 × 1021 cm−2 mag−1.The orange points are those that were excluded from the fitting process, as they are in very high extinction areas, where the optical extinction relation breaks down.
Current usage metrics show cumulative count of Article Views (full-text article views including HTML views, PDF and ePub downloads, according to the available data) and Abstracts Views on Vision4Press platform.
Data correspond to usage on the plateform after 2015. The current usage metrics is available 48-96 hours after online publication and is updated daily on week days.
Initial download of the metrics may take a while.