Fig. B.3
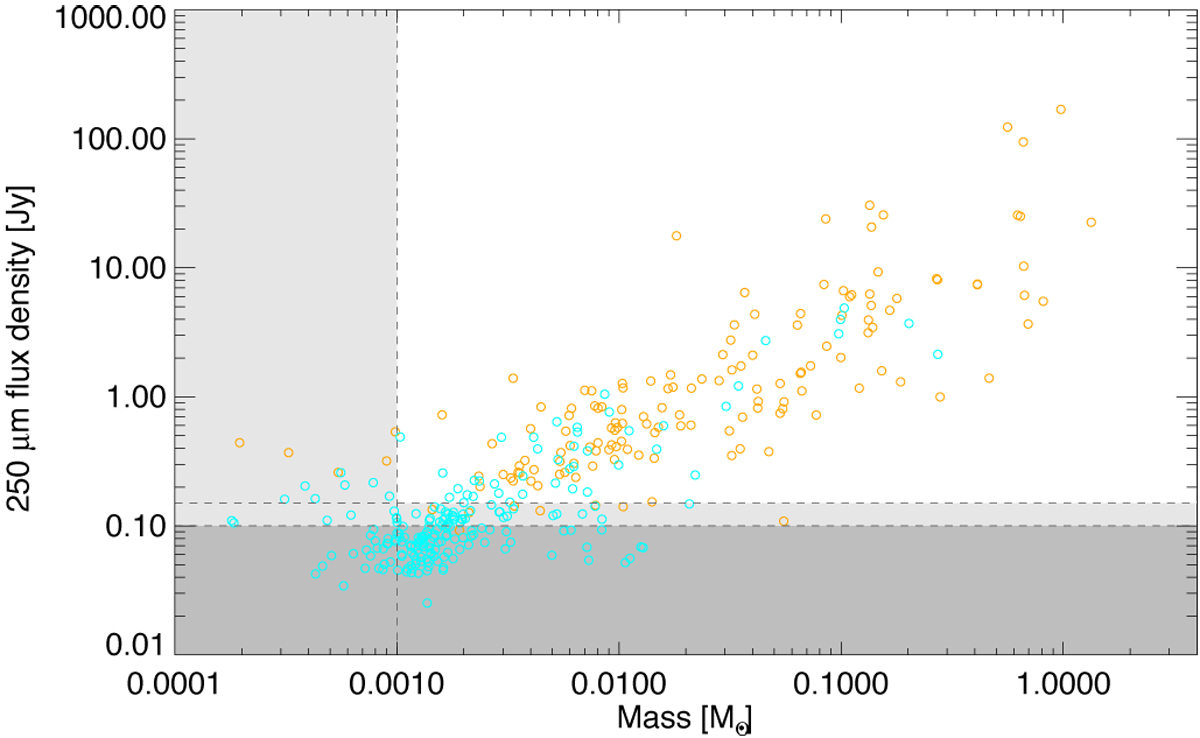
Mass against integrated flux density at 250 μm for all sources, regardless of their bound state or subregion. The orange circles and cyan circles show sources that lie within the western and eastern tiles, respectively. The lower dashed line shows the approximate 100 mJy 250-μm contamination limit, below which we exclude sources from the catalogue on the ground that they are mostlikely to be extragalactic. The upper dashed line shows the 150 mJy cut applied to the sources, below which sources are included in the catalogue but excluded from the scientific discussion because a high fraction of them may be extragalactic. The vertical dashed line shows the 0.001 M⊙ mass limit, below which we exclude cores from the scientific discussion. In general, sources within the dark grey area are excluded from the catalogue and discussion. Sources within the light grey area are included within the catalogue, but excluded from the scientific discussion, and given a “core type” of −1. Sources within the white area are included within the catalogue and scientific discussion.
Current usage metrics show cumulative count of Article Views (full-text article views including HTML views, PDF and ePub downloads, according to the available data) and Abstracts Views on Vision4Press platform.
Data correspond to usage on the plateform after 2015. The current usage metrics is available 48-96 hours after online publication and is updated daily on week days.
Initial download of the metrics may take a while.