Fig. A.3
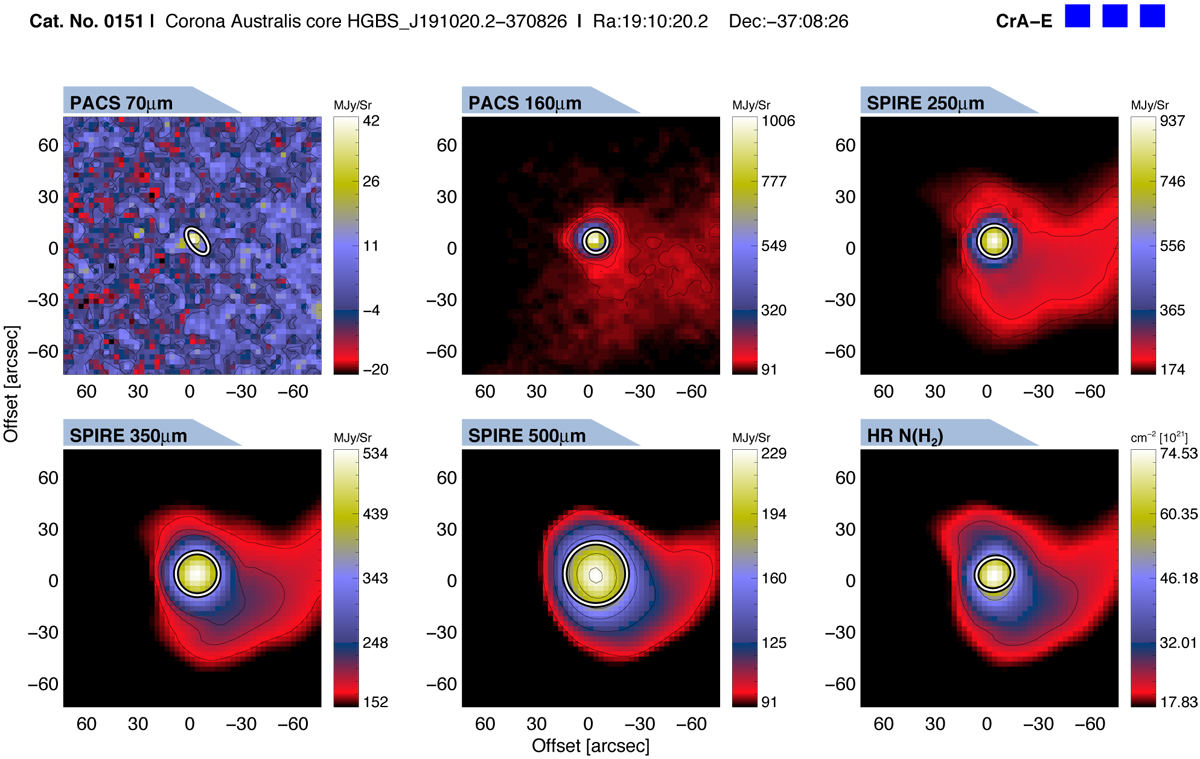
Example “card” for a (bound) prestellar core. We show Herschel images at 70, 160, 250, 350, and 500 μm. We also show the high-resolution column density image of the core. Ellipses represent the estimated major and minor FWHM sizes of the core at each wavelength. If a core is significantly detected at the respective wavelength, the line is solid, andis dashed otherwise. We provide a complete set of these images for the dense cores. Each card cut-out is ~2.5′ across, on a 3′′ pixel grid.
Current usage metrics show cumulative count of Article Views (full-text article views including HTML views, PDF and ePub downloads, according to the available data) and Abstracts Views on Vision4Press platform.
Data correspond to usage on the plateform after 2015. The current usage metrics is available 48-96 hours after online publication and is updated daily on week days.
Initial download of the metrics may take a while.