Fig. A.2
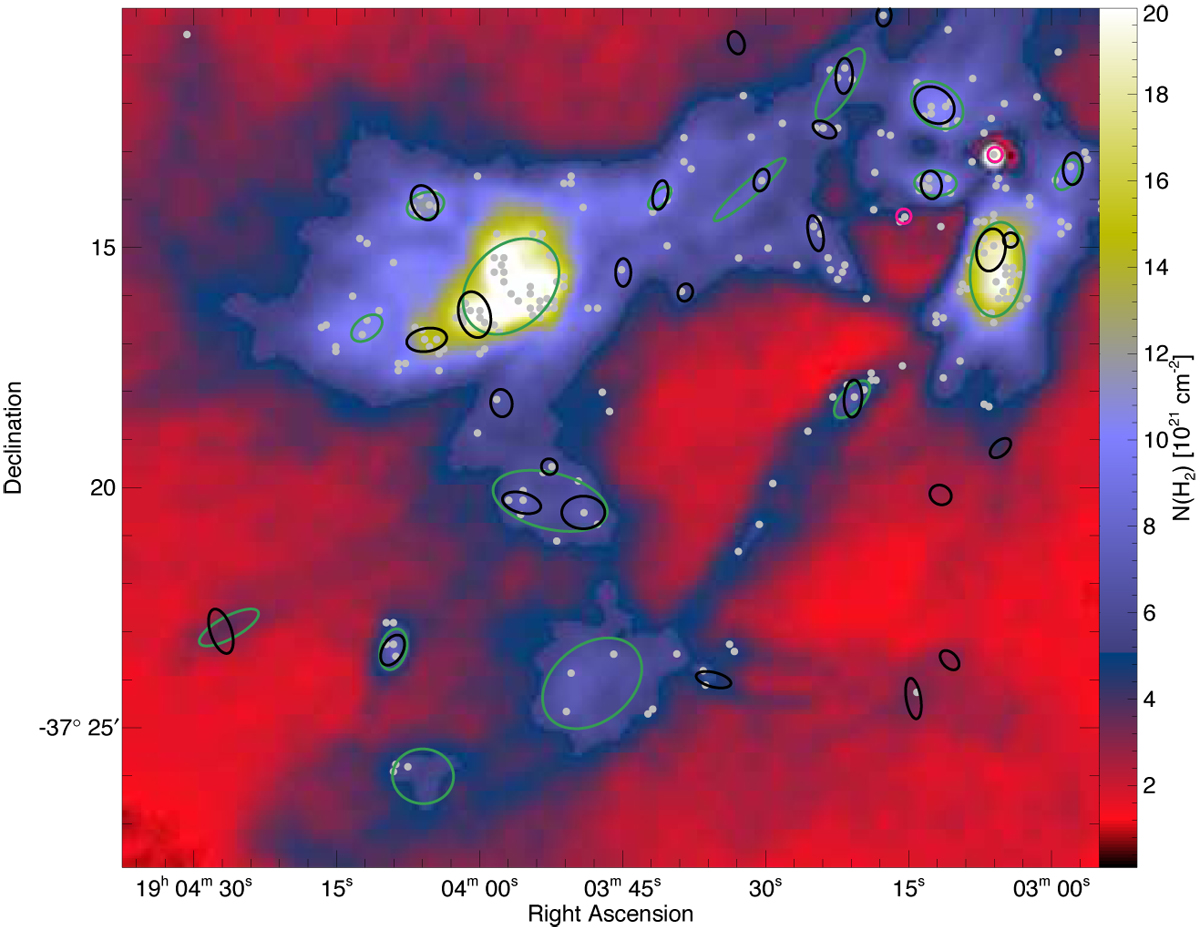
Magnified view of an arbitrary sub-field within CrA. The background map is the high-resolution column density map. Black and pink ellipses mark the FWHM sizes of the dense cores and protostellar cores, respectively. The green ellipses show the CSAR (Kirk et al. 2013) identified sources. The grey points show sources identified using CuTEx (Molinari et al. 2011). Both CSAR and CuTEx were used on the high-resolution column density image.
Current usage metrics show cumulative count of Article Views (full-text article views including HTML views, PDF and ePub downloads, according to the available data) and Abstracts Views on Vision4Press platform.
Data correspond to usage on the plateform after 2015. The current usage metrics is available 48-96 hours after online publication and is updated daily on week days.
Initial download of the metrics may take a while.